Consider the trigonometric function y= 2sin - Wewill il out the table and plot S points so that we can see the graph and sketch it. Solve for from last line Solve for y The S points arex from row 2 y value from row 4 her we have 5 points, we know that the graph of sine looks like a wave. Hence the graph can be sketched with the 5 points. You can extend the graph by copying the graph from the 5 points to the left and right because the graph of sine function is periodic
Consider the trigonometric function y= 2sin - Wewill il out the table and plot S points so that we can see the graph and sketch it. Solve for from last line Solve for y The S points arex from row 2 y value from row 4 her we have 5 points, we know that the graph of sine looks like a wave. Hence the graph can be sketched with the 5 points. You can extend the graph by copying the graph from the 5 points to the left and right because the graph of sine function is periodic

Algebra & Trigonometry with Analytic Geometry
13th Edition
ISBN:9781133382119
Author:Swokowski
Publisher:Swokowski
Chapter6: The Trigonometric Functions
Section6.4: Values Of The Trigonometric Functions
Problem 40E

Related questions
Question
Transcribed Image Text:(- - 5).
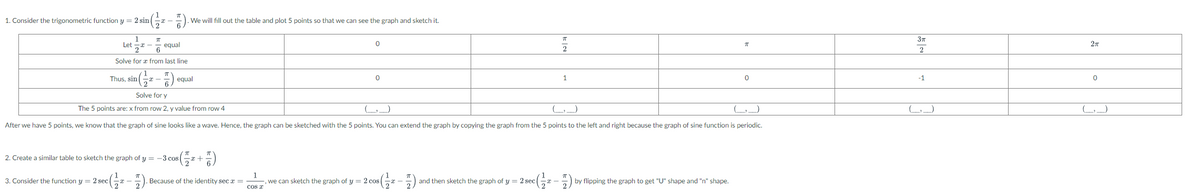
1. Consider the trigonometric function y = 2 sin
.We will fill out the table and plot 5 points so that we can see the graph and sketch it.
1
Let -a -
equal
6
2
2
Solve for æ from last line
;- - )
Thus, sin
equal
1.
-1
Solve for y
The 5 points are: x from row 2, y value from row 4
After we have 5 points, we know that the graph of sine looks like a wave. Hence, the graph can be sketched with the 5 points. You can extend the graph by copying the graph from the 5 points to the left and right because the graph of sine function is periodic.
2. Create a similar table to sketch the graph of y = -3 cos(r +)
3. Consider the function y = 2 sec(a – ).
Because of the identity sec x
,we can sketch the graph of y= 2 cos
cos a
2 sec(-) by flipping the graph to get "U" shape and "n" shape.
and then sketch the graph of y =
Expert Solution
This question has been solved!
Explore an expertly crafted, step-by-step solution for a thorough understanding of key concepts.

Step by step
Solved in 2 steps

Recommended textbooks for you
Algebra & Trigonometry with Analytic Geometry
Algebra
ISBN:
9781133382119
Author:
Swokowski
Publisher:
Cengage

Algebra and Trigonometry (MindTap Course List)
Algebra
ISBN:
9781305071742
Author:
James Stewart, Lothar Redlin, Saleem Watson
Publisher:
Cengage Learning
Algebra & Trigonometry with Analytic Geometry
Algebra
ISBN:
9781133382119
Author:
Swokowski
Publisher:
Cengage
Algebra and Trigonometry (MindTap Course List)
Algebra
ISBN:
9781305071742
Author:
James Stewart, Lothar Redlin, Saleem Watson
Publisher:
Cengage Learning