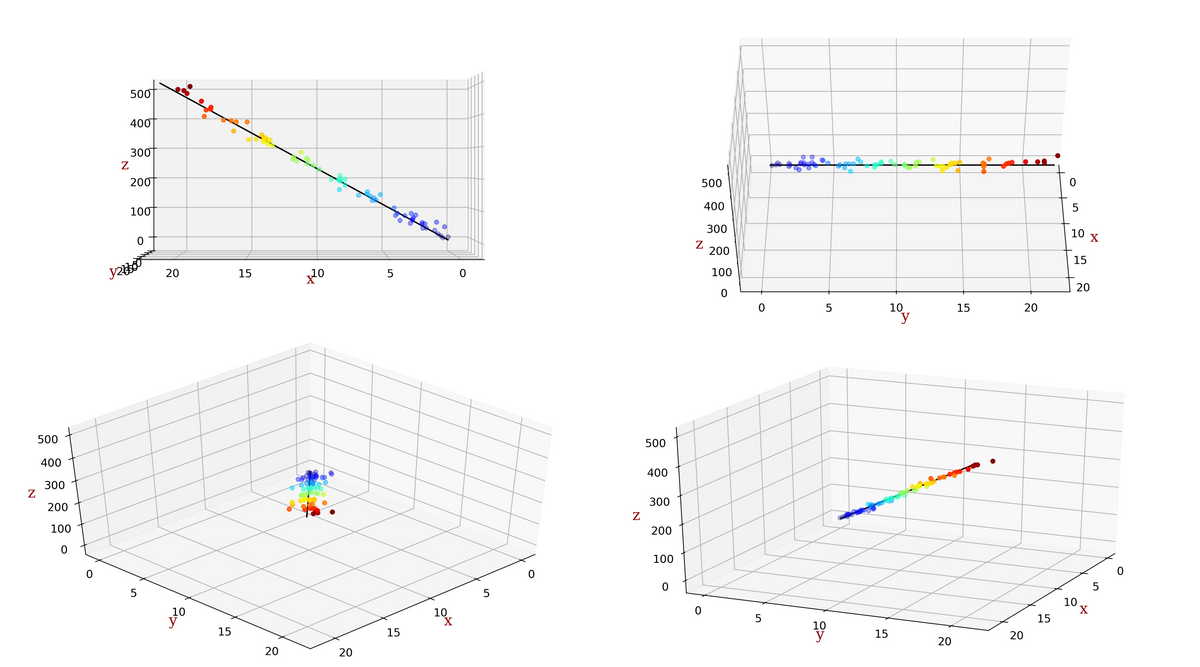
Create Second Image Use the following x_fit and y_fit data to compute z_fit by invoking the model's predict() method. This will allow you to plot the line of best fit that is predicted by the model. ]: # Plot Curve Fit from mpl_toolkits import mplot3d from matplotlib.ticker import LinearLocator, FormatStrFormatter %matplotlib inline %matplotlib notebook x_fit = np.linspace(-21, 21,1000)| y_fit = x_fit x_fit = x_fit.reshape(-1,1) y_fit = y_fit.reshape(-1,1) PolyReg LinearRegression() PolyReg.fit(x_fit, y_fit) mixData = pd.DataFrame({'x_fit': [x_fit], 'y_fit': [y_fit]}) z_fit = PolyReg. predict (mixData["x_fit"][0]) plt.scatter(x_fit, y_fit) plt.plot(x fit 7 fit C='vellow')
Create Second Image Use the following x_fit and y_fit data to compute z_fit by invoking the model's predict() method. This will allow you to plot the line of best fit that is predicted by the model. ]: # Plot Curve Fit from mpl_toolkits import mplot3d from matplotlib.ticker import LinearLocator, FormatStrFormatter %matplotlib inline %matplotlib notebook x_fit = np.linspace(-21, 21,1000)| y_fit = x_fit x_fit = x_fit.reshape(-1,1) y_fit = y_fit.reshape(-1,1) PolyReg LinearRegression() PolyReg.fit(x_fit, y_fit) mixData = pd.DataFrame({'x_fit': [x_fit], 'y_fit': [y_fit]}) z_fit = PolyReg. predict (mixData["x_fit"][0]) plt.scatter(x_fit, y_fit) plt.plot(x fit 7 fit C='vellow')
COMPREHENSIVE MICROSOFT OFFICE 365 EXCE
1st Edition
ISBN:9780357392676
Author:FREUND, Steven
Publisher:FREUND, Steven
Chapter8: Working With Trendlines, Pivottables, Pivotcharts, And Slicers
Section: Chapter Questions
Problem 8EYW
Related questions
Question
![Create Second Image
Use the following x_fit and y_fit data to compute z_fit by invoking the model's predict() method. This will allow you to plot the line of best fit that
is predicted by the model.
7]: # Plot Curve Fit
from mpl_toolkits import mplot3d
from matplotlib.ticker import LinearLocator, FormatStrFormatter
%matplotlib inline
%matplotlib notebook
x_fit = np.linspace(-21, 21, 1000)|
y_fit = x_fit
x_fit = x_fit.reshape(-1,1)
y_fit = y_fit.reshape(-1,1)
PolyReg = LinearRegression()
PolyReg.fit(x_fit, y_fit)
mixData = pd.DataFrame({'x_fit': [x_fit], 'y_fit': [y_fit]})
z_fit = PolyReg.predict (mixData["x_fit"][0])
plt.scatter(x_fit, y_fit)
plt.plot(x_fit, z_fit, c='yellow')](/v2/_next/image?url=https%3A%2F%2Fcontent.bartleby.com%2Fqna-images%2Fquestion%2F9a439e6e-0de6-4cc8-b17b-db5a75b83157%2Fcdd8bca2-d47e-45e7-bb0f-4814e36832f2%2Fvl3johm_processed.png&w=3840&q=75)
Transcribed Image Text:Create Second Image
Use the following x_fit and y_fit data to compute z_fit by invoking the model's predict() method. This will allow you to plot the line of best fit that
is predicted by the model.
7]: # Plot Curve Fit
from mpl_toolkits import mplot3d
from matplotlib.ticker import LinearLocator, FormatStrFormatter
%matplotlib inline
%matplotlib notebook
x_fit = np.linspace(-21, 21, 1000)|
y_fit = x_fit
x_fit = x_fit.reshape(-1,1)
y_fit = y_fit.reshape(-1,1)
PolyReg = LinearRegression()
PolyReg.fit(x_fit, y_fit)
mixData = pd.DataFrame({'x_fit': [x_fit], 'y_fit': [y_fit]})
z_fit = PolyReg.predict (mixData["x_fit"][0])
plt.scatter(x_fit, y_fit)
plt.plot(x_fit, z_fit, c='yellow')

Transcribed Image Text:Z
500
400
300
200
100
О
О
Z
500
400
300
200
100
угаа
5
О
20
10
у
15
0
О
15
20
110
20
5
15
10
X
о
5
О
N
500
400
300
200
100
О
500
Z
О
400
300
200
100
О
О
5
прове
5
10
у
15
10
у
20
15
20
20
15
0
5
10
15
20
10
X
X
5
О
Expert Solution
This question has been solved!
Explore an expertly crafted, step-by-step solution for a thorough understanding of key concepts.
This is a popular solution!
Trending now
This is a popular solution!
Step by step
Solved in 2 steps

Knowledge Booster
Learn more about
Need a deep-dive on the concept behind this application? Look no further. Learn more about this topic, computer-science and related others by exploring similar questions and additional content below.Recommended textbooks for you

COMPREHENSIVE MICROSOFT OFFICE 365 EXCE
Computer Science
ISBN:
9780357392676
Author:
FREUND, Steven
Publisher:
CENGAGE L

COMPREHENSIVE MICROSOFT OFFICE 365 EXCE
Computer Science
ISBN:
9780357392676
Author:
FREUND, Steven
Publisher:
CENGAGE L