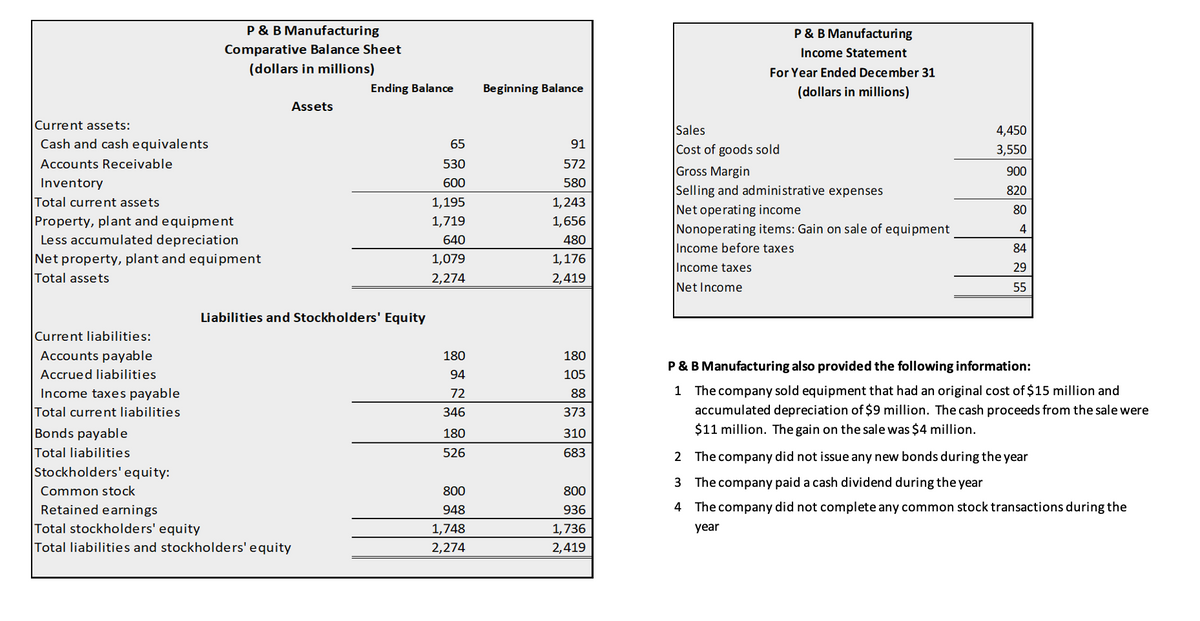
Current assets: Cash and cash equivalents Accounts Receivable Inventory Total current assets Property, plant and equipment Less accumulated depreciation Net property, plant and equipment Total assets Current liabilities: Accounts payable Accrued liabilities Income taxes payable Total current liabilities P & B Manufacturing Comparative Balance Sheet (dollars in millions) Bonds payable Total liabilities Stockholders' equity: Common stock Retained earnings Assets Ending Balance Liabilities and Stockholders' Equity Total stockholders' equity Total liabilities and stockholders' equity 65 530 600 1,195 1,719 640 1,079 2,274 180 94 72 346 180 526 800 948 1,748 2,274 Beginning Balance 91 572 580 1,243 1,656 480 1,176 2,419 180 105 88 373 310 683 800 936 1,736 2,419 P & B Manufacturing Income Statement For Year Ended December 31 (dollars in millions) Sales Cost of goods sold Gross Margin Selling and administrative expenses Net operating income Nonoperating items: Gain on sale of equipment Income before taxes Income taxes Net Income 4,450 3,550 900 820 80 4 84 29 55 P & B Manufacturing also provided the following information: 1 The company sold equipment that had an original cost of $15 million and accumulated depreciation of $9 million. The cash proceeds from the sale were $11 million. The gain on the sale was $4 million. 2 The company did not issue any new bonds during the year 3 The company paid a cash dividend during the year 4 The company did not complete any common stock transactions during the year


Reporting Cash Flows
Reporting of cash flows means a statement of cash flow which is a financial statement. A cash flow statement is prepared by gathering all the data regarding inflows and outflows of a company. The cash flow statement includes cash inflows and outflows from various activities such as operating, financing, and investment. Reporting this statement is important because it is the main financial statement of the company.
Balance Sheet
A balance sheet is an integral part of the set of financial statements of an organization that reports the assets, liabilities, equity (shareholding) capital, other short and long-term debts, along with other related items. A balance sheet is one of the most critical measures of the financial performance and position of the company, and as the name suggests, the statement must balance the assets against the liabilities and equity. The assets are what the company owns, and the liabilities represent what the company owes. Equity represents the amount invested in the business, either by the promoters of the company or by external shareholders. The total assets must match total liabilities plus equity.
Financial Statements
Financial statements are written records of an organization which provide a true and real picture of business activities. It shows the financial position and the operating performance of the company. It is prepared at the end of every financial cycle. It includes three main components that are balance sheet, income statement and cash flow statement.
Owner's Capital
Before we begin to understand what Owner’s capital is and what Equity financing is to an organization, it is important to understand some basic accounting terminologies. A double-entry bookkeeping system Normal account balances are those which are expected to have either a debit balance or a credit balance, depending on the nature of the account. An asset account will have a debit balance as normal balance because an asset is a debit account. Similarly, a liability account will have the normal balance as a credit balance because it is amount owed, representing a credit account. Equity is also said to have a credit balance as its normal balance. However, sometimes the normal balances may be reversed, often due to incorrect journal or posting entries or other accounting/ clerical errors.
I need help to determine the following;
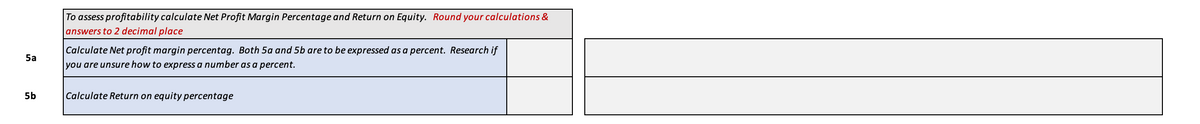
5. For P & B Manufacturing to assess its profitability I need help to calculate the net profit margin percentage AND the return on equity. Include calculations and round answers to 2 decimal places.

Step by step
Solved in 2 steps


