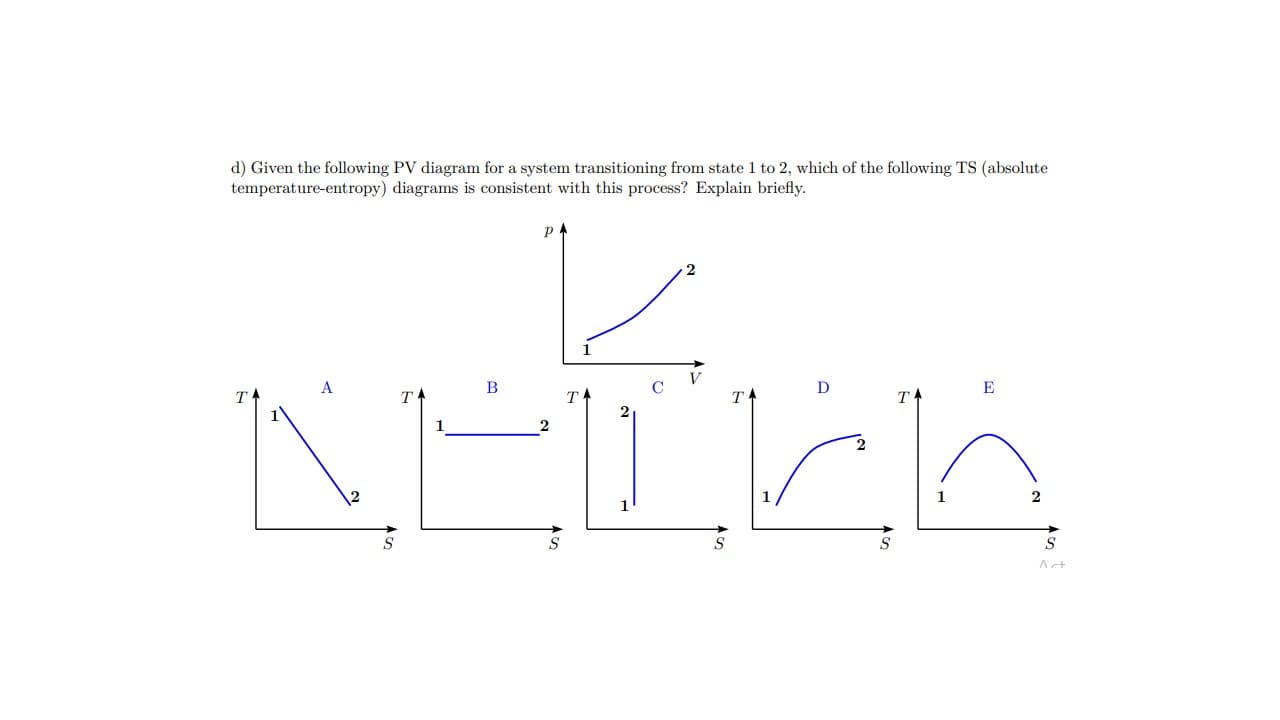
d) Given the following PV diagram for a system transitioning from state 1 to 2, which of the following TS (absolute temperature-entropy) diagrams is consistent with this process? Explain briefly. A B C D E TA T T T T 2 1 1 2 1 S S S S S Act 2.

Q: Here we have successfully built up a problem that uses one topic from each of the four quarters of m...
A: Given: FBD: Firstly, calculating the force acting on m1 due to pressure p = 1atm, which is pushing...
Q: What difference does an astronomer see between the emission spectrum of an element in a receding sta...
A: The frequency of the emitted beam will be different for the emission spectra of a receding star and ...
Q: The local atmospheric pressure in Denver, Colorado (elevation 1610 m) is 83.4 kPa. Air at this press...
A:
Q: Suppose that you want to find out how much gasoline is in an underground storage tank. You pour in 1...
A:
Q: 2) The magnetic flux density in a region of free space is given by B = -x² ax + 2y³ ay - 2z az T. Fi...
A: The magnetic force acting on a current carrying conductor is given by So let's consider The Rectang...
Q: Considering the figure shown, suppose that qa = qd and qb = qc . First show that q is in static equi...
A: Since the charges qa and qd are equal in magnitude and equidistant from charge q, the force exerted ...
Q: Th Consider two ideal engines added in series, as shown in the figure, where the heat Engine I of th...
A: The efficiency of an ideal (reversible) heat engine is given by, The efficiency for an ideal engine...
Q: A balloon filled with 3.50 kg of water at a temperature of 22°C is dropped from rest from an airplan...
A:
Q: 5. A parachutist weighing 192 lb falls from a plane (that is vo =0). When the parachutist's speed is...
A: Given weight 192 lb. And air resistance =3v2 Let's assume at time t=0 the parachute has speed 60 ft/...
Q: Th Consider two ideal engines added in series, as shown in the figure, where the heat Engine I >W, o...
A:
Q: İt is just a question on study plan so it isn't effective for the grades of Physics-2 so if you can ...
A: Since the particle is moving on a circular path therefore there must be a centripetal force acting o...
Q: Fermi’s original reactor was just “barely” critical because the natural uranium that he used contain...
A:
Q: How many hours would it take to dissipate 47.95 J of energy in a 748 Ohm resistor with a voltage of ...
A: The expression for the required time,
Q: Make a drawing similar to the figure, but with the pendulum moving in the opposite direction. Then u...
A:
Q: Two tiny spheres, A and B are situated along the x-axis with qA = +1 nC at the origin and qB = +1 nC...
A: Consider a point between the two given charges. At this point electric field due to both charges act...
Q: please explain it too
A: The angular momentum of a system remains constant unless acted on by an external torque. Since here ...
Q: The inner and out radius of toroid is 15 cm and 18 cm respectively. This toroid made up of 250 turns...
A: (a) The point 12 cm from the center corresponds to a point outside the toroid. A circular path at th...
Q: Evaluate 20y dA where D is the shaded part of the graph of y = V4 - x2 (a semicircle of radius 2). (...
A: We can see for the shaded part X varies from 1 to 2. And y varies from 0 to √(4-x2) We know the area...
Q: I don't know how to do this problem. Can you help me
A:
Q: Please answer the question below. Show all of your work and each step.
A: Let the radius of the planer part be defined as x. therefore the area of the planer side be given as...
Q: recall from this chapter,that the factor gamma governs both time dilation and length contraction,whe...
A:
Q: A galaxy cluster has a recessional velocity of 19,000 km/s. Using the best estimate for Hubble's con...
A: To calculate the distance of the distant galaxies in megaparsecs (Mpc) Hubble’s law is used. If the ...
Q: Natural uranium contains the common isotope 238 U and the uncommon isotope 235U. The principal mecha...
A: The only naturally occurring fissile nuclide is Uranium 235U. Fissile nuclides are the nuclides whic...
Q: 5. An asymmetrical rectangular loop with current I = 32A is placed in the xy plane in free space as ...
A: Hello. Since your question has multiple sub-parts, we will solve first three sub-parts for you. If y...
Q: When light goes from an unknown plastic into water (n = 1.33), it exhibits total internal reflection...
A:
Q: A 15.0-lb block rests on a horizontal floor. (a) What force does the floor exert on the block? (b) A...
A:
Q: 1. Two point charges are located in space as shown in the figure. The distance between the charges i...
A:
Q: Explain the high intensity of the power of the laser.
A: In order to achieve high intensities, combination of solid-state lasers emitting very short pulses a...
Q: Please Solve all parts! Don't Leave any.
A: (a) Given the electric field intensity. The divergence of E be calculated as,
Q: "Aristarchus' Method of Determining the Distance to the Sun" At the first quarter of the Moon (at po...
A:
Q: Light travels a certain distance in, say, 20,000 years. How is it possible that an astronaut, travel...
A: Light travels a specific distance in 20,000 years with respect to the observer’s frame of reference....
Q: 1. A hollow metal sphere has an inner radius, R, =5 cm, and an outer radius, R, = 6 cm. The metal sp...
A: (i) The energy of the photon be determined as,
Q: Find the Fourier transform specified in part (a) and then use it to answer part (b). a) Find the Fou...
A: (a) Using exponential multiplication property, the Fourier transform of the given function be calcul...
Q: İt is just a question on study plan so it isn't effective for the grades of Physics-2 so if you can ...
A: Electric filed due to the axis of the charged ring at x distance from the center is given as, Here R...
Q: In the theory of relativity, the energy of a particle is E = /mở c* + h*c*/X² where mo is the rest m...
A:
Q: One mole of an ideal gas undergoes an adiabatic free expansion from V = 12.3 L and T = 300 K to V2 =...
A: Given
Q: A hollow metal sphere has an inner radius, R =5 cm, and an outer radius, R, = 6 cm. The metal sphere...
A:
Q: The speed of sound, cs, in a perfect gas of molar mass M is related to the ratio of heat capacities ...
A:
Q: An open cylindrical tank 350 mm in diameter and 1.8 m high is inserted vertically into a body of wat...
A: Volume of the concrete
Q: A player kicks a football at an angle of 37° with the horizontal and with an initial speed of 16 ms....
A: The traveled distance is, The taken time is,
Q: Advanced Physics Question
A: (2) Coronal mass ejection is the ejection of plasma with a very strong magnetic field from the Sun’s...
Q: Demonstrate the sensitivity of foveal vision. Look at the letter G in the word ROGERS. What about th...
A: Foveal vision refers to the vision in the center of the field of vision, where visual acuity is at i...
Q: Calculate the height of a satellite from the surface of the Earth so that its radial acceleration wi...
A:
Q: 5. An asymmetrical rectangular loop with current I = 36A is placed in the xy plane in free space as ...
A: Hello. Since your question has multiple sub-parts, we will solve first three sub-parts for you. If y...
Q: 8) A rigid body with mass m is performing a damped oscillation in one dimension. Write the different...
A:
Q: A particle describes an arc of circumference of 6.6 m radius. At the instant in which the speed is v...
A: The tangential acceleration be given as, Where, aT be defined as the tangential acceleration. ac be...
Q: A manometer tube is filled with two type of liquids. The density of liquid 1 is p1 = 0.8 g.cm-3, and...
A: The expression for the height by equating the pressure,
Q: Electrons are ejected from a metallic surface with speed of up to 5.8 x 106cm/s, when light with a w...
A:
Q: A parallel plate capacitor with air between its plates is charged to 86.6 V and then disconnected fr...
A:


Trending now
This is a popular solution!

Step by step
Solved in 2 steps with 2 images
