d) Graphs of the revenue and cost functions are shown below. Answer the following questions. R(x), C(x) i) Which of the two graphs represents the revenue function? (Circle one) D Parabola Straight line 10000- ii) Identify all the break-even points. (Circle all that apply.) E A B C DE E 5000- A C iii) In the graph, shade the area(s) that represents the profit. F OIB 3000 1000 2000
d) Graphs of the revenue and cost functions are shown below. Answer the following questions. R(x), C(x) i) Which of the two graphs represents the revenue function? (Circle one) D Parabola Straight line 10000- ii) Identify all the break-even points. (Circle all that apply.) E A B C DE E 5000- A C iii) In the graph, shade the area(s) that represents the profit. F OIB 3000 1000 2000

Algebra & Trigonometry with Analytic Geometry
13th Edition
ISBN:9781133382119
Author:Swokowski
Publisher:Swokowski
Chapter3: Functions And Graphs
Section: Chapter Questions
Problem 13T

Related questions
Question
Transcribed Image Text:d)
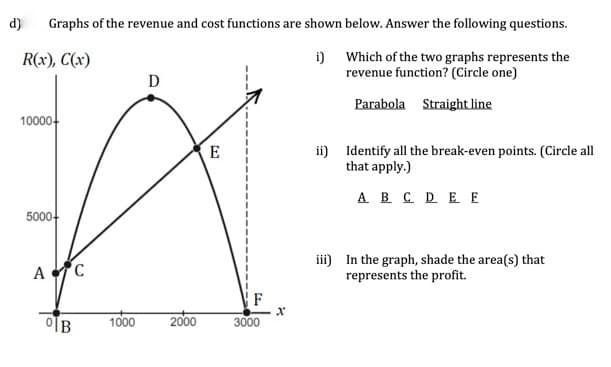
Graphs of the revenue and cost functions are shown below. Answer the following questions.
R(x), C(x)
Which of the two graphs represents the
i)
revenue function? (Circle one)
D
Parabola Straight line
10000-
ii) Identify all the break-even points. (Circle all
that apply.)
E
A B C DE E
5000+
iii) In the graph, shade the area(s) that
represents the profit.
A
F
이B
3000
1000
2000
Expert Solution
This question has been solved!
Explore an expertly crafted, step-by-step solution for a thorough understanding of key concepts.

Step by step
Solved in 2 steps with 1 images

Recommended textbooks for you
Algebra & Trigonometry with Analytic Geometry
Algebra
ISBN:
9781133382119
Author:
Swokowski
Publisher:
Cengage
Algebra & Trigonometry with Analytic Geometry
Algebra
ISBN:
9781133382119
Author:
Swokowski
Publisher:
Cengage