D Q The region D above can be describe in two ways. 1. If we visualize the region having "top" and "bottom" boundaries, express each as functions of and provide the interval of x-values that covers the entire region. "top" boundary 92(x) = "bottom" boundary 9₁ (x) = interval of a values that covers the region = 2. If we visualize the region having "right" and "left" boundaries, express each as functions of y and provide the interval of y-values that covers the entire region. "right" boundary f2(y) "left" boundary fi(y) = interval of y values that covers the region = Check Answer
D Q The region D above can be describe in two ways. 1. If we visualize the region having "top" and "bottom" boundaries, express each as functions of and provide the interval of x-values that covers the entire region. "top" boundary 92(x) = "bottom" boundary 9₁ (x) = interval of a values that covers the region = 2. If we visualize the region having "right" and "left" boundaries, express each as functions of y and provide the interval of y-values that covers the entire region. "right" boundary f2(y) "left" boundary fi(y) = interval of y values that covers the region = Check Answer

Intermediate Algebra
10th Edition
ISBN:9781285195728
Author:Jerome E. Kaufmann, Karen L. Schwitters
Publisher:Jerome E. Kaufmann, Karen L. Schwitters
Chapter7: Equations And Inequalities In Two Variables
Section7.1: Rectangular Coordinate System And Linear Equations
Problem 59PS: Now lets use a graphing calculator to get a graph of C=59(F32). By letting F=x and C=y, we obtain...

Related questions
Question
It’s all one question and I need help
Chapter 5 question 5
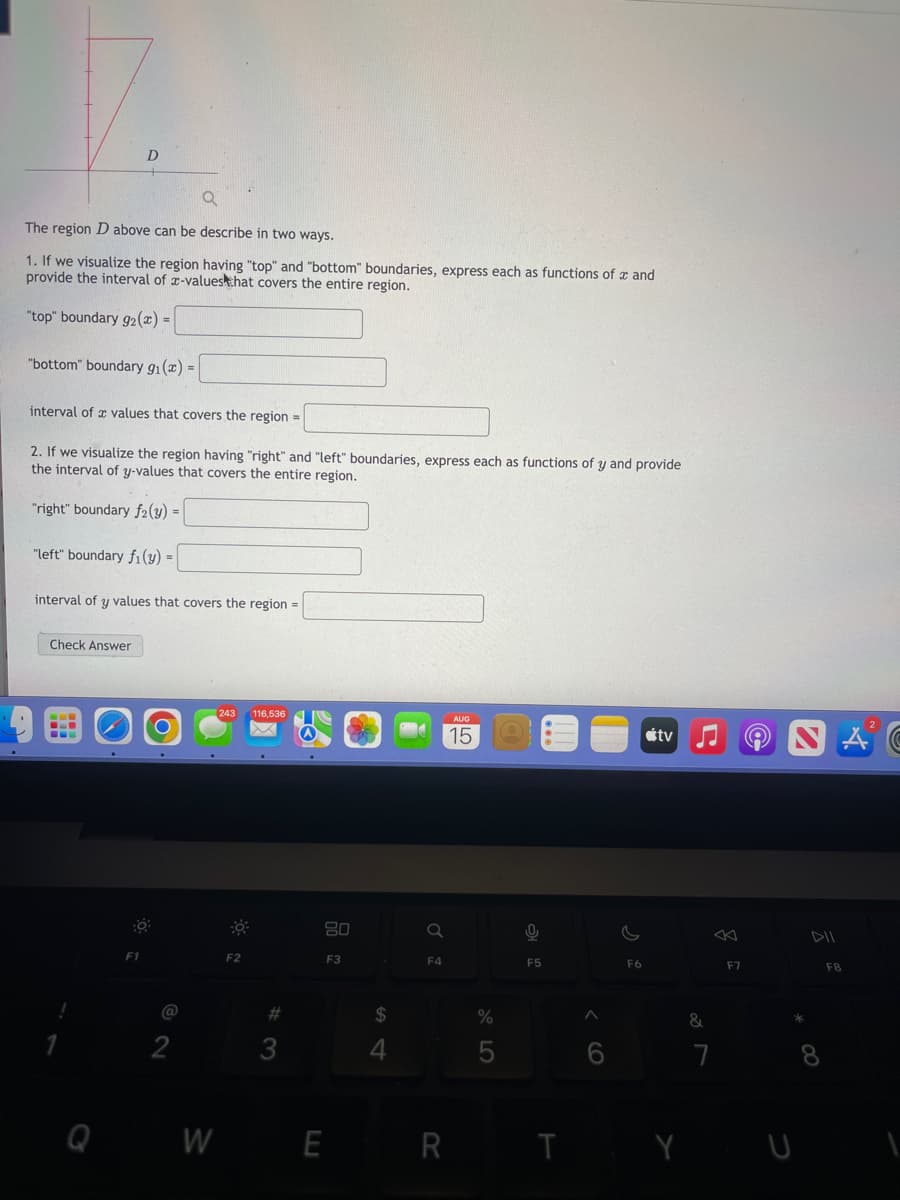
Transcribed Image Text:The region D above can be describe in two ways.
1. If we visualize the region having "top" and "bottom" boundaries, express each as functions of and
provide the interval of x-values that covers the entire region.
"top" boundary 92(x) =
"bottom" boundary 9₁(x) =
D
interval of values that covers the region =
2. If we visualize the region having "right" and "left" boundaries, exp
the interval of y-values that covers the entire region.
"right" boundary f2(y) =
"left" boundary fi(y) =
interval of y values that covers the region =
Check Answer
F1
O
@
2
243 116.536
F2
#3
80
F3
QWE
54
$
Q
F4
R
AUG
15
each
%
5
functions of y and provide
0
F5
CO
C
F6
tv
&
7
F7
ONAC
*
T YU
F8
Expert Solution
This question has been solved!
Explore an expertly crafted, step-by-step solution for a thorough understanding of key concepts.

Step by step
Solved in 3 steps with 3 images

Recommended textbooks for you
Intermediate Algebra
Algebra
ISBN:
9781285195728
Author:
Jerome E. Kaufmann, Karen L. Schwitters
Publisher:
Cengage Learning

Functions and Change: A Modeling Approach to Coll…
Algebra
ISBN:
9781337111348
Author:
Bruce Crauder, Benny Evans, Alan Noell
Publisher:
Cengage Learning

Algebra & Trigonometry with Analytic Geometry
Algebra
ISBN:
9781133382119
Author:
Swokowski
Publisher:
Cengage
Intermediate Algebra
Algebra
ISBN:
9781285195728
Author:
Jerome E. Kaufmann, Karen L. Schwitters
Publisher:
Cengage Learning
Functions and Change: A Modeling Approach to Coll…
Algebra
ISBN:
9781337111348
Author:
Bruce Crauder, Benny Evans, Alan Noell
Publisher:
Cengage Learning
Algebra & Trigonometry with Analytic Geometry
Algebra
ISBN:
9781133382119
Author:
Swokowski
Publisher:
Cengage

Big Ideas Math A Bridge To Success Algebra 1: Stu…
Algebra
ISBN:
9781680331141
Author:
HOUGHTON MIFFLIN HARCOURT
Publisher:
Houghton Mifflin Harcourt

College Algebra
Algebra
ISBN:
9781305115545
Author:
James Stewart, Lothar Redlin, Saleem Watson
Publisher:
Cengage Learning
