(d) Use the known information on the estimate the true average age of the trees. Construct the 95% confidence inte true average age of all the trees in the stand based on the regression estimator. (e) Which interval estimate is better and why? appropriate? Why? umbst of
(d) Use the known information on the estimate the true average age of the trees. Construct the 95% confidence inte true average age of all the trees in the stand based on the regression estimator. (e) Which interval estimate is better and why? appropriate? Why? umbst of

Algebra: Structure And Method, Book 1
(REV)00th Edition
ISBN:9780395977224
Author:Richard G. Brown, Mary P. Dolciani, Robert H. Sorgenfrey, William L. Cole
Publisher:Richard G. Brown, Mary P. Dolciani, Robert H. Sorgenfrey, William L. Cole
Chapter9: Systems Of Linear Equations
Section9.6: Wind And Water Current Problems
Problem 8P

Related questions
Question
100%
2.1 Last 3 parts
Provide solution for d,e,f parts
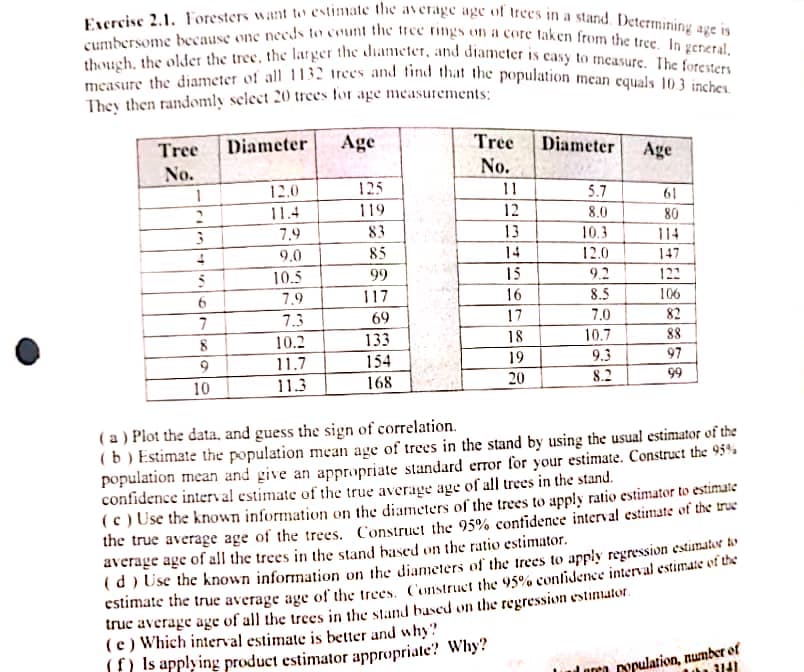
Transcribed Image Text:Exercise 2.1. Foresters want to estimate the average age of trees in a stand. Determining age is
cumbersome because one needs to count the tree rings on a core taken from the tree. In general.
though, the older the tree, the larger the diameter, and diameter is easy to measure. The foresters
measure the diameter of all 1132 trees and find that the population mean equals 10.3 inches.
They then randomly select 20 trees for age measurements:
Age
Tree
No.
1
2
3
4
S
6
7
8
9
10
Diameter
12.0
11.4
7.9
9.0
10.5
7.9
7.3
10.2
11.7
11.3
125
119
83
85
99
117
69
133
154
168
Tree
No.
11
12
13
14
15
16
17
18
19
20
Diameter
5.7
8.0
10.3
12.0
9.2
8.5
7.0
10.7
9.3
8.2
Age
Lerca
61
80
114
147
122
106
82
88
97
99
(a) Plot the data, and guess the sign of correlation.
(b) Estimate the population mean age of trees in the stand by using the usual estimator of the
population mean and give an appropriate standard error for your estimate. Construct the 95%
confidence interval estimate of the true average age of all trees in the stand.
(c) Use the known information on the diameters of the trees to apply ratio estimator to estimate
the true average age of the trees. Construct the 95% confidence interval estimate of the true
average age of all the trees in the stand based on the ratio estimator.
(d) Use the known information on the diameters of the trees to apply regression estimator to
estimate the true average age of the trees. Construct the 95% confidence interval estimate of the
true average age of all the trees in the stand based on the regression estimator.
(e) Which interval estimate is better and why?
(f) Is applying product estimator appropriate? Why?
population, number of
3141
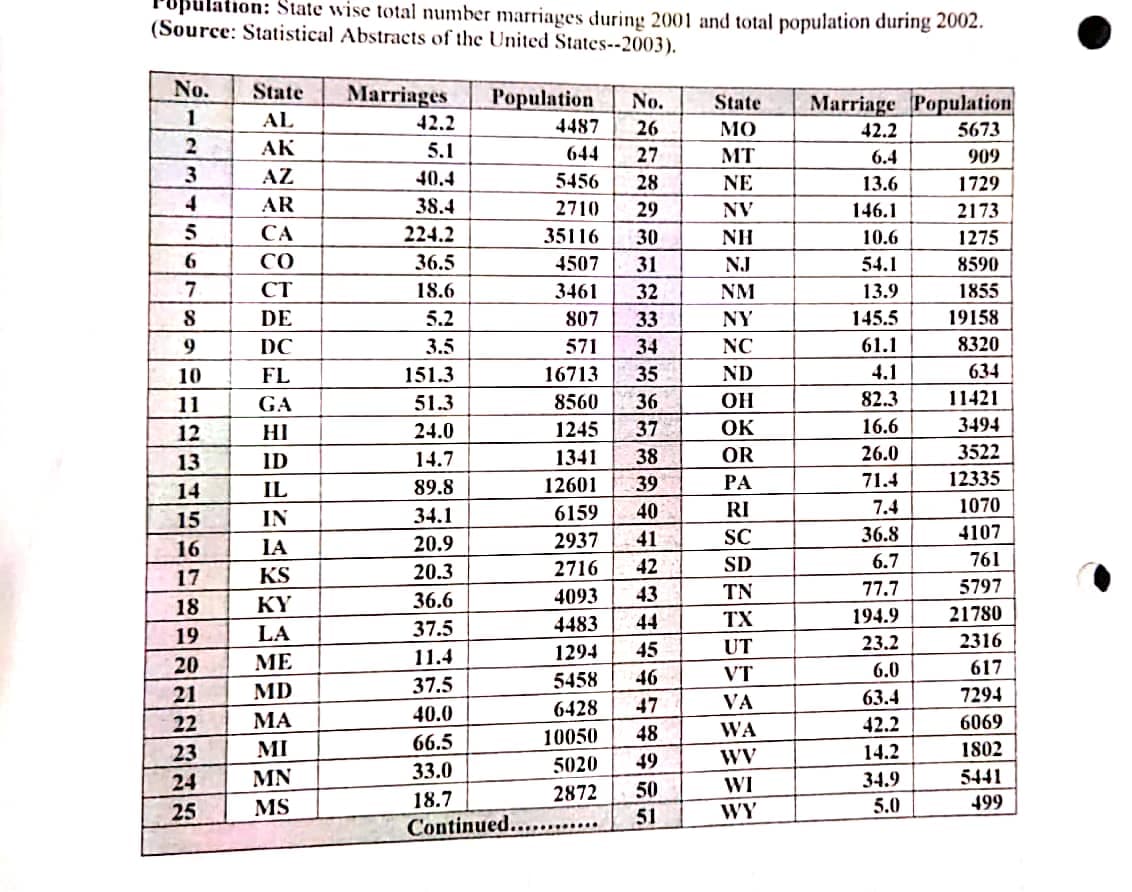
Transcribed Image Text:Upulation: State wise total number marriages during 2001 and total population during 2002.
(Source: Statistical Abstracts of the United States--2003).
No. State Marriages
1
AL
2
AK
3
4
5
6
7
8
9
10
SHAREE
11
12
13
14
15
16
17
18
HERRERIES
19
20
21
22
23
24
25
AZ
AR
CA
CO
CT
DE
DC
FL
GA
НІ
ID
IL
IN
IA
KS
KY
LA
ME
MD
ΜΑ
MI
MN
MS
42.2
5.1
40.4
38.4
224.2
36.5
18.6
5.2
3.5
Population
151.3
51.3
24.0
14.7
89.8
34.1
20.9
20.3
36.6
37.5
11.4
37.5
40.0
66.5
33.0
18.7
Continued...
4487
644
5456
2710
35116
4507
3461
807
571
16713
8560
1245
1341
12601
6159
2937
2716
4093
4483
1294
5458
6428
10050
5020
2872
6 26 27 38 29 301 32 33 34 35 363738 39 40 41 2 3 44 45 46 48 49 50 51
No.
28
42
43
47
State Marriage Population
MO
MT
NE
NV
NH
NJ
NM
NY
NC
ND
OH
OK
OR
PA
RI
SC
SD
TN
TX
UT
VT
VA
WA
WV
WI
WY
42.2
6.4
13.6
146.1
10.6
54.1
13.9
145.5
61.1
4.1
82.3
16.6
26.0
71.4
7.4
36.8
6.7
77.7
194.9
23.2
6.0
63.4
42.2
14.2
34.9
5.0
5673
909
1729
2173
1275
8590
1855
19158
8320
634
11421
3494
3522
12335
1070
4107
761
5797
21780
2316
617
7294
6069
1802
5441
499
Expert Solution
This question has been solved!
Explore an expertly crafted, step-by-step solution for a thorough understanding of key concepts.

Step by step
Solved in 3 steps with 2 images

Recommended textbooks for you
Algebra: Structure And Method, Book 1
Algebra
ISBN:
9780395977224
Author:
Richard G. Brown, Mary P. Dolciani, Robert H. Sorgenfrey, William L. Cole
Publisher:
McDougal Littell

Big Ideas Math A Bridge To Success Algebra 1: Stu…
Algebra
ISBN:
9781680331141
Author:
HOUGHTON MIFFLIN HARCOURT
Publisher:
Houghton Mifflin Harcourt

Intermediate Algebra
Algebra
ISBN:
9781285195728
Author:
Jerome E. Kaufmann, Karen L. Schwitters
Publisher:
Cengage Learning
Algebra: Structure And Method, Book 1
Algebra
ISBN:
9780395977224
Author:
Richard G. Brown, Mary P. Dolciani, Robert H. Sorgenfrey, William L. Cole
Publisher:
McDougal Littell
Big Ideas Math A Bridge To Success Algebra 1: Stu…
Algebra
ISBN:
9781680331141
Author:
HOUGHTON MIFFLIN HARCOURT
Publisher:
Houghton Mifflin Harcourt
Intermediate Algebra
Algebra
ISBN:
9781285195728
Author:
Jerome E. Kaufmann, Karen L. Schwitters
Publisher:
Cengage Learning


Trigonometry (MindTap Course List)
Trigonometry
ISBN:
9781337278461
Author:
Ron Larson
Publisher:
Cengage Learning