Data for llang-llang Trading Company are given below: 2014 2015 Current Assets 192,375 937,508 152,618 1,282,500 265,500 967,500 159,750 1,392,750 Property, Plant, and Equipment Other Assets Total Assets Liabilities Total Current Liabilities 220,590 491,198 225,450 460,250 Long term Debt Owner's Capital 570,713 706.950 TOTAL 1,282,500 1,392,750 Requirements: a. Prepare a common-size Statement of Financial Position for 2014 and 2013 for llang-llang Trading Company. b. Prepare a horizontal analysis for llang-llang Trading Company.
Data for llang-llang Trading Company are given below: 2014 2015 Current Assets 192,375 937,508 152,618 1,282,500 265,500 967,500 159,750 1,392,750 Property, Plant, and Equipment Other Assets Total Assets Liabilities Total Current Liabilities 220,590 491,198 225,450 460,250 Long term Debt Owner's Capital 570,713 706.950 TOTAL 1,282,500 1,392,750 Requirements: a. Prepare a common-size Statement of Financial Position for 2014 and 2013 for llang-llang Trading Company. b. Prepare a horizontal analysis for llang-llang Trading Company.

Chapter1: Financial Statements And Business Decisions
Section: Chapter Questions
Problem 1Q

Related questions
Question
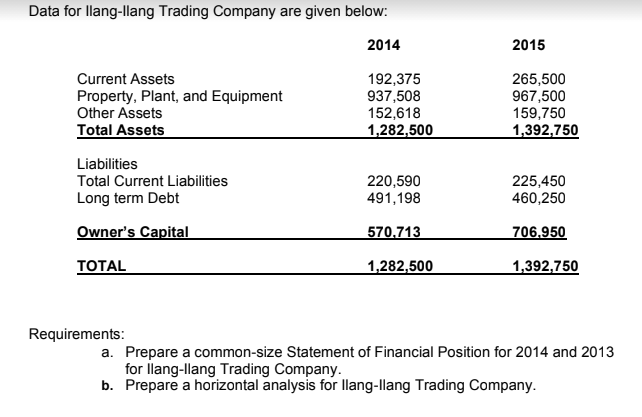
Transcribed Image Text:Data for llang-llang Trading Company are given below:
2014
2015
Current Assets
Property, Plant, and Equipment
Other Assets
Total Assets
192,375
937,508
152,618
1,282,500
265,500
967,500
159,750
1,392,750
Liabilities
Total Current Liabilities
220,590
491,198
225,450
460,250
Long term Debt
Owner's Capital
570,713
706.950
ТOTAL
1,282,500
1,392,750
Requirements:
a. Prepare a common-size Statement of Financial Position for 2014 and 2013
for llang-llang Trading Company.
b. Prepare a horizontal analysis for llang-llang Trading Company.
Expert Solution
This question has been solved!
Explore an expertly crafted, step-by-step solution for a thorough understanding of key concepts.

Step by step
Solved in 2 steps with 2 images

Recommended textbooks for you

Accounting
Accounting
ISBN:
9781337272094
Author:
WARREN, Carl S., Reeve, James M., Duchac, Jonathan E.
Publisher:
Cengage Learning,

Accounting Information Systems
Accounting
ISBN:
9781337619202
Author:
Hall, James A.
Publisher:
Cengage Learning,
Accounting
Accounting
ISBN:
9781337272094
Author:
WARREN, Carl S., Reeve, James M., Duchac, Jonathan E.
Publisher:
Cengage Learning,
Accounting Information Systems
Accounting
ISBN:
9781337619202
Author:
Hall, James A.
Publisher:
Cengage Learning,

Horngren's Cost Accounting: A Managerial Emphasis…
Accounting
ISBN:
9780134475585
Author:
Srikant M. Datar, Madhav V. Rajan
Publisher:
PEARSON

Intermediate Accounting
Accounting
ISBN:
9781259722660
Author:
J. David Spiceland, Mark W. Nelson, Wayne M Thomas
Publisher:
McGraw-Hill Education

Financial and Managerial Accounting
Accounting
ISBN:
9781259726705
Author:
John J Wild, Ken W. Shaw, Barbara Chiappetta Fundamental Accounting Principles
Publisher:
McGraw-Hill Education