Data from 14 cities were combined for a 20-year period, and the total 280 city-years included a total of 143 homicides. After finding the mean number of homicides per city-year, find the probability that a randomly selected city-year has the following numbers of homicides, then compare the actual results to those expected by using the Poisson probabilities: Homicides each city-year а. О b. 1 с. 2 d. 3 e. 4 Actual results 167 87 22 4 a. P(0) = (Round to four decimal places as needed.) %3D
Data from 14 cities were combined for a 20-year period, and the total 280 city-years included a total of 143 homicides. After finding the mean number of homicides per city-year, find the probability that a randomly selected city-year has the following numbers of homicides, then compare the actual results to those expected by using the Poisson probabilities: Homicides each city-year а. О b. 1 с. 2 d. 3 e. 4 Actual results 167 87 22 4 a. P(0) = (Round to four decimal places as needed.) %3D

Algebra & Trigonometry with Analytic Geometry
13th Edition
ISBN:9781133382119
Author:Swokowski
Publisher:Swokowski
Chapter10: Sequences, Series, And Probability
Section10.8: Probability
Problem 19E

Related questions
Question
Please help with all questions.
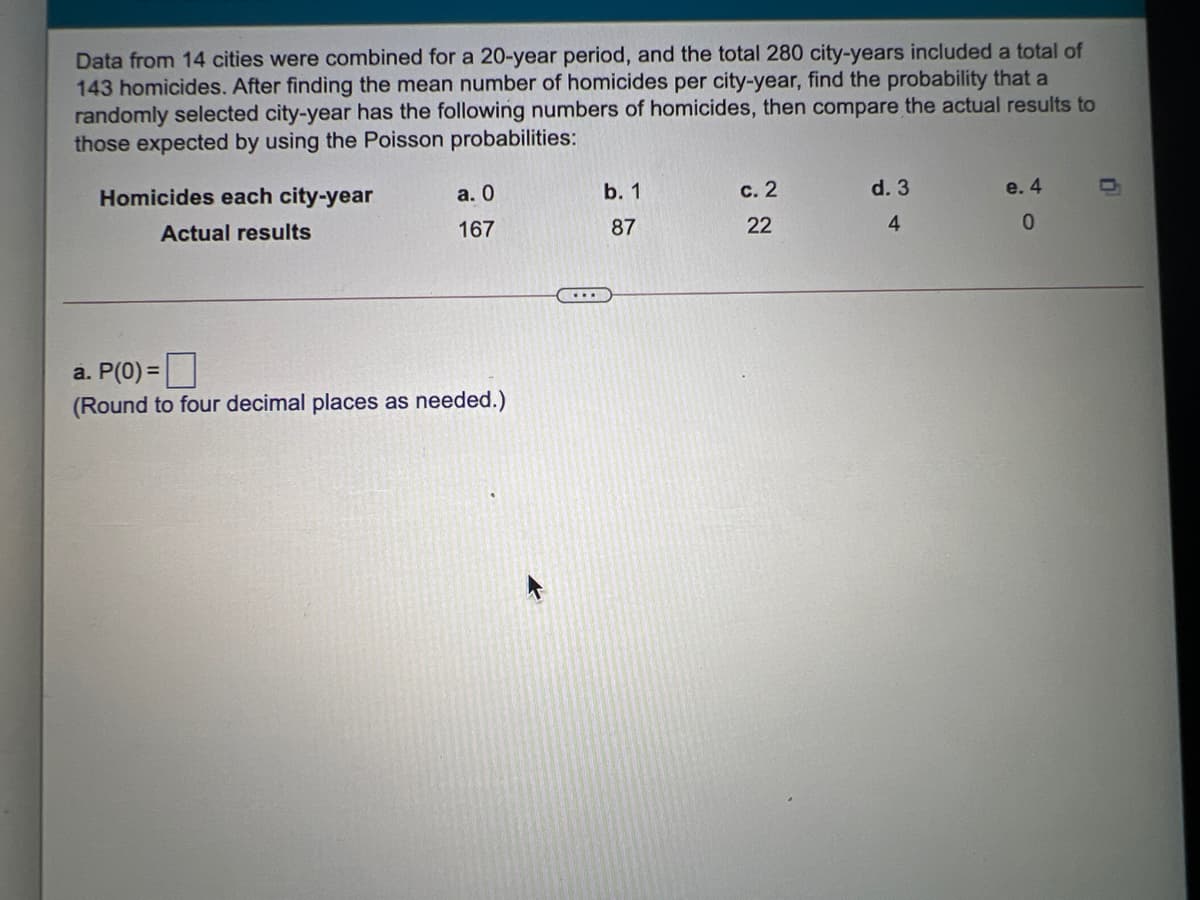
Transcribed Image Text:Data from 14 cities were combined for a 20-year period, and the total 280 city-years included a total of
143 homicides. After finding the mean number of homicides per city-year, find the probability that a
randomly selected city-year has the following numbers of homicides, then compare the actual results to
those expected by using the Poisson probabilities:
Homicides each city-year
а. О
b. 1
с. 2
d. 3
e. 4
Actual results
167
87
22
4
a. P(0) =|
(Round to four decimal places as needed.)
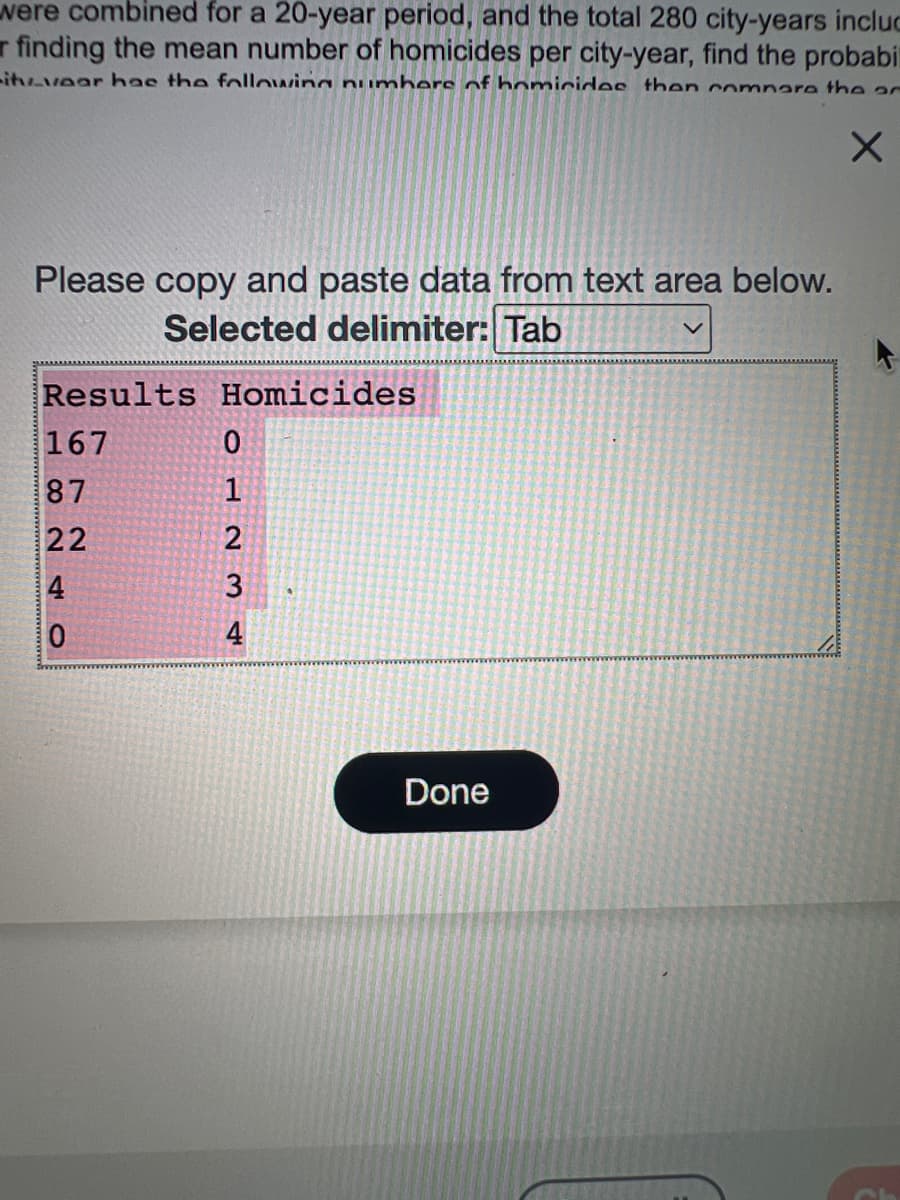
Transcribed Image Text:were combined for a 20-year period, and the total 280 city-years incluc
r finding the mean number of homicides per city-year, find the probabi
itvvear has the following numbers of bomicides then compare the ar
Please copy and paste data from text area below.
Selected delimiter: Tab
Results Homicides
167
87
22
4
4
Done
Expert Solution
This question has been solved!
Explore an expertly crafted, step-by-step solution for a thorough understanding of key concepts.

This is a popular solution!

Trending now
This is a popular solution!

Step by step
Solved in 2 steps with 2 images

Recommended textbooks for you
Algebra & Trigonometry with Analytic Geometry
Algebra
ISBN:
9781133382119
Author:
Swokowski
Publisher:
Cengage

Algebra & Trigonometry with Analytic Geometry
Algebra
ISBN:
9781133382119
Author:
Swokowski
Publisher:
Cengage