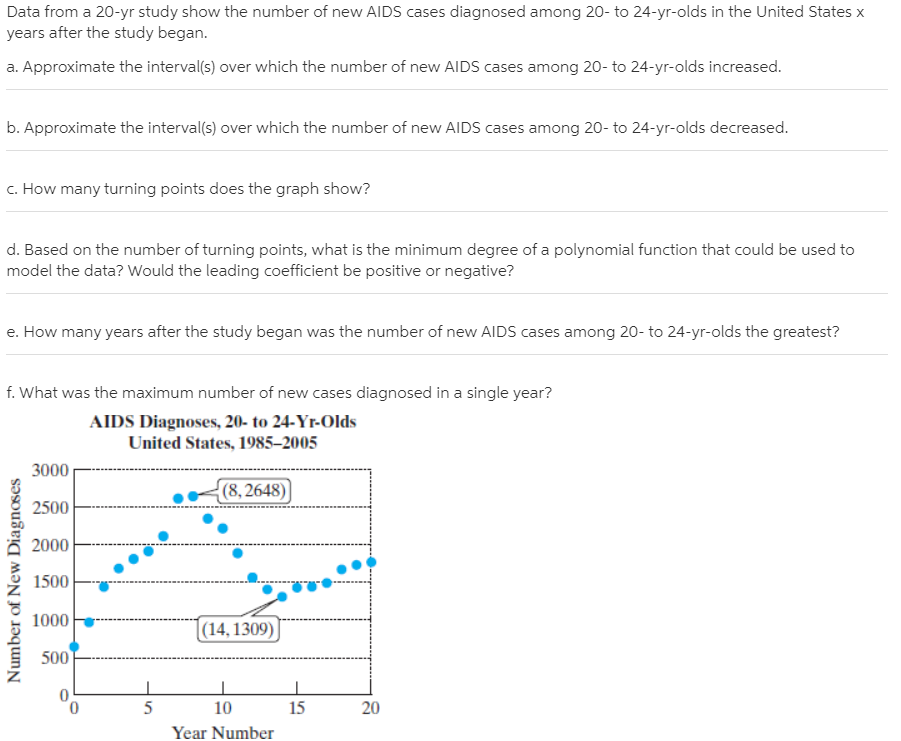
Data from a 20-yr study show the number of new AIDS cases diagnosed among 20- to 24-yr-olds in the United States x years after the study began. a. Approximate the interval(s) over which the number of new AIDS cases among 20- to 24-yr-olds increased. b. Approximate the interval(s) over which the number of new AIDS cases among 20- to 24-yr-olds decreased. c. How many turning points does the graph show? d. Based on the number of turning points, what is the minimum degree of a polynomial function that could be used to model the data? Would the leading coefficient be positive or negative? e. How many years after the study began was the number of new AIDS cases among 20- to 24-yr-olds the greatest? f. What was the maximum number of new cases diagnosed in a single year? AIDS Diagnoses, 20- to 24-Yr-Olds United States, 1985–2005 3000 (8, 2648) 2500 2000 1500 1000 |(14, 1309) 500 5 10 15 20 Year Number Number of New Diagnoses
Data from a 20-yr study show the number of new AIDS cases diagnosed among 20- to 24-yr-olds in the United States x years after the study began. a. Approximate the interval(s) over which the number of new AIDS cases among 20- to 24-yr-olds increased. b. Approximate the interval(s) over which the number of new AIDS cases among 20- to 24-yr-olds decreased. c. How many turning points does the graph show? d. Based on the number of turning points, what is the minimum degree of a polynomial function that could be used to model the data? Would the leading coefficient be positive or negative? e. How many years after the study began was the number of new AIDS cases among 20- to 24-yr-olds the greatest? f. What was the maximum number of new cases diagnosed in a single year? AIDS Diagnoses, 20- to 24-Yr-Olds United States, 1985–2005 3000 (8, 2648) 2500 2000 1500 1000 |(14, 1309) 500 5 10 15 20 Year Number Number of New Diagnoses

Algebra & Trigonometry with Analytic Geometry
13th Edition
ISBN:9781133382119
Author:Swokowski
Publisher:Swokowski
Chapter10: Sequences, Series, And Probability
Section10.2: Arithmetic Sequences
Problem 67E

Related questions
Question
Transcribed Image Text:Data from a 20-yr study show the number of new AIDS cases diagnosed among 20- to 24-yr-olds in the United States x
years after the study began.
a. Approximate the interval(s) over which the number of new AIDS cases among 20- to 24-yr-olds increased.
b. Approximate the interval(s) over which the number of new AIDS cases among 20- to 24-yr-olds decreased.
c. How many turning points does the graph show?
d. Based on the number of turning points, what is the minimum degree of a polynomial function that could be used to
model the data? Would the leading coefficient be positive or negative?
e. How many years after the study began was the number of new AIDS cases among 20- to 24-yr-olds the greatest?
f. What was the maximum number of new cases diagnosed in a single year?
AIDS Diagnoses, 20- to 24-Yr-Olds
United States, 1985–2005
3000
(8, 2648)
2500
2000
1500
1000
|(14, 1309)
500
5
10
15
20
Year Number
Number of New Diagnoses
Expert Solution
This question has been solved!
Explore an expertly crafted, step-by-step solution for a thorough understanding of key concepts.

This is a popular solution!

Trending now
This is a popular solution!

Step by step
Solved in 2 steps with 2 images

Recommended textbooks for you
Algebra & Trigonometry with Analytic Geometry
Algebra
ISBN:
9781133382119
Author:
Swokowski
Publisher:
Cengage

Big Ideas Math A Bridge To Success Algebra 1: Stu…
Algebra
ISBN:
9781680331141
Author:
HOUGHTON MIFFLIN HARCOURT
Publisher:
Houghton Mifflin Harcourt

Glencoe Algebra 1, Student Edition, 9780079039897…
Algebra
ISBN:
9780079039897
Author:
Carter
Publisher:
McGraw Hill
Algebra & Trigonometry with Analytic Geometry
Algebra
ISBN:
9781133382119
Author:
Swokowski
Publisher:
Cengage
Big Ideas Math A Bridge To Success Algebra 1: Stu…
Algebra
ISBN:
9781680331141
Author:
HOUGHTON MIFFLIN HARCOURT
Publisher:
Houghton Mifflin Harcourt
Glencoe Algebra 1, Student Edition, 9780079039897…
Algebra
ISBN:
9780079039897
Author:
Carter
Publisher:
McGraw Hill

Holt Mcdougal Larson Pre-algebra: Student Edition…
Algebra
ISBN:
9780547587776
Author:
HOLT MCDOUGAL
Publisher:
HOLT MCDOUGAL