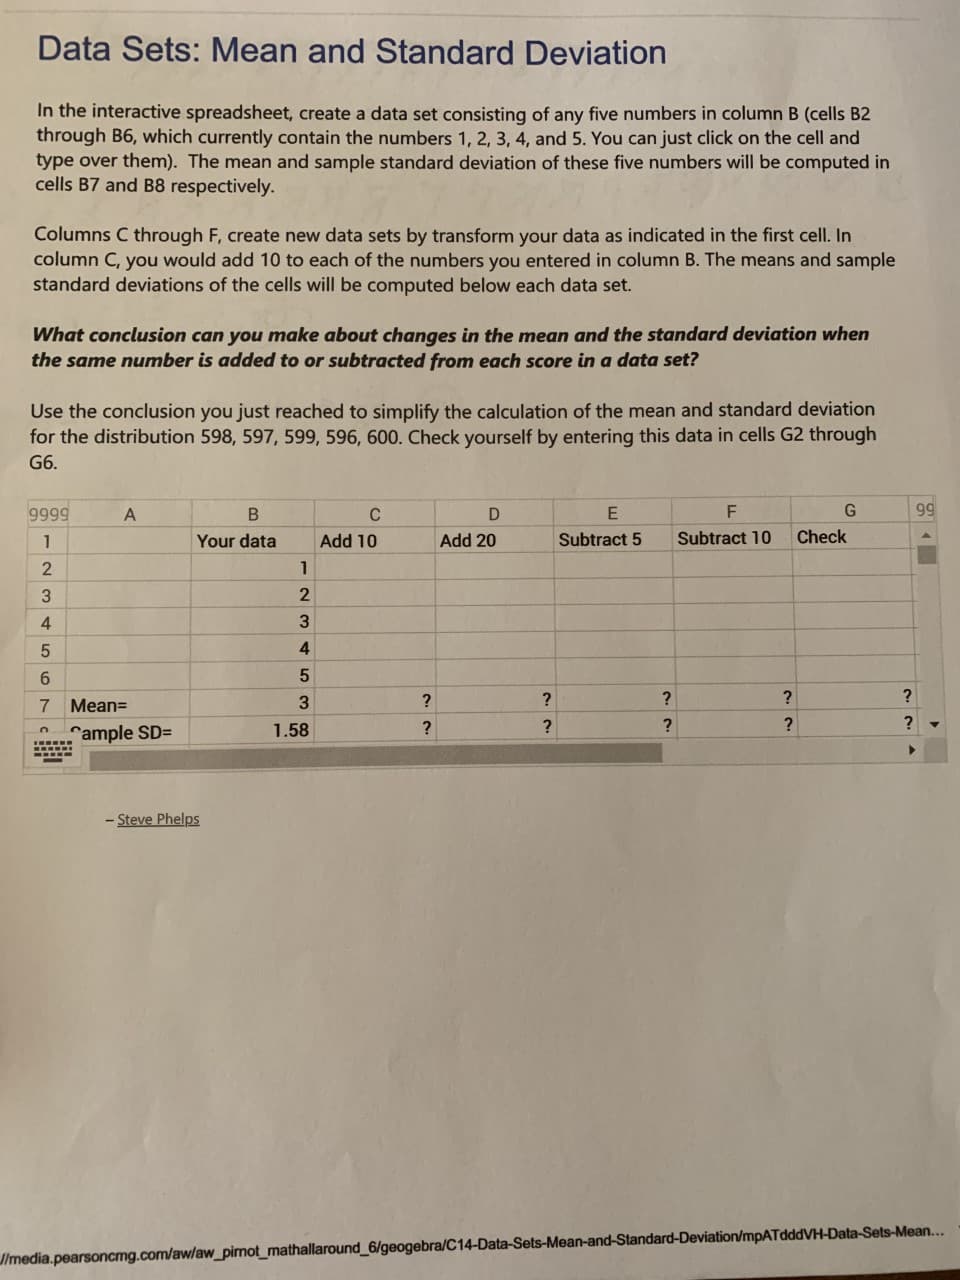
Data Sets: Mean and Standard Deviation In the interactive spreadsheet, create a data set consisting of any five numbers in column B (cells B2 through B6, which currently contain the numbers 1, 2, 3, 4, and 5. You can just click on the cell and type over them). The mean and sample standard deviation of these five numbers will be computed in cells B7 and B8 respectively. Columns C through F, create new data sets by transform your data as indicated in the first cell. In column C, you would add 10 to each of the numbers you entered in column B. The means and sample standard deviations of the cells will be computed below each data set. What conclusion can you make about changes in the mean and the standard deviation when the same number is added to or subtracted from each score in a data set? Use the conclusion you just reached to simplify the calculation of the mean and standard deviation for the distribution 598, 597, 599, 596, 600. Check yourself by entering this data in cells G2 through G6. 9999 G 99 Your data Add 10 Add 20 Subtract 5 Subtract 10 Check 3 6. Mean= 3. Cample SD= 1.58 Steve Phelps Jlmedia.pearsoncmg.com/aw/aw_pimot_mathallaround_6/geogebra/C14-Data-Sets-Mean-and-Standard-Deviation/mpATdddVH-Data-Sets-Mean...


Inverse Normal Distribution
The method used for finding the corresponding z-critical value in a normal distribution using the known probability is said to be an inverse normal distribution. The inverse normal distribution is a continuous probability distribution with a family of two parameters.
Mean, Median, Mode
It is a descriptive summary of a data set. It can be defined by using some of the measures. The central tendencies do not provide information regarding individual data from the dataset. However, they give a summary of the data set. The central tendency or measure of central tendency is a central or typical value for a probability distribution.
Z-Scores
A z-score is a unit of measurement used in statistics to describe the position of a raw score in terms of its distance from the mean, measured with reference to standard deviation from the mean. Z-scores are useful in statistics because they allow comparison between two scores that belong to different normal distributions.
Use the data sets: Mean and standard deviation applet to answer the question below. Understand the mean and standard deviation of a data set.
You are asked to fill out a spreadsheet to create some data and then change the data according to the direction ( that is, add 10, and 20, etc.). The spreadsheet found the mean and the SD of your data sets. What pattern did you find for the SD of the data sets?


Trending now
This is a popular solution!

Step by step
Solved in 2 steps with 2 images


