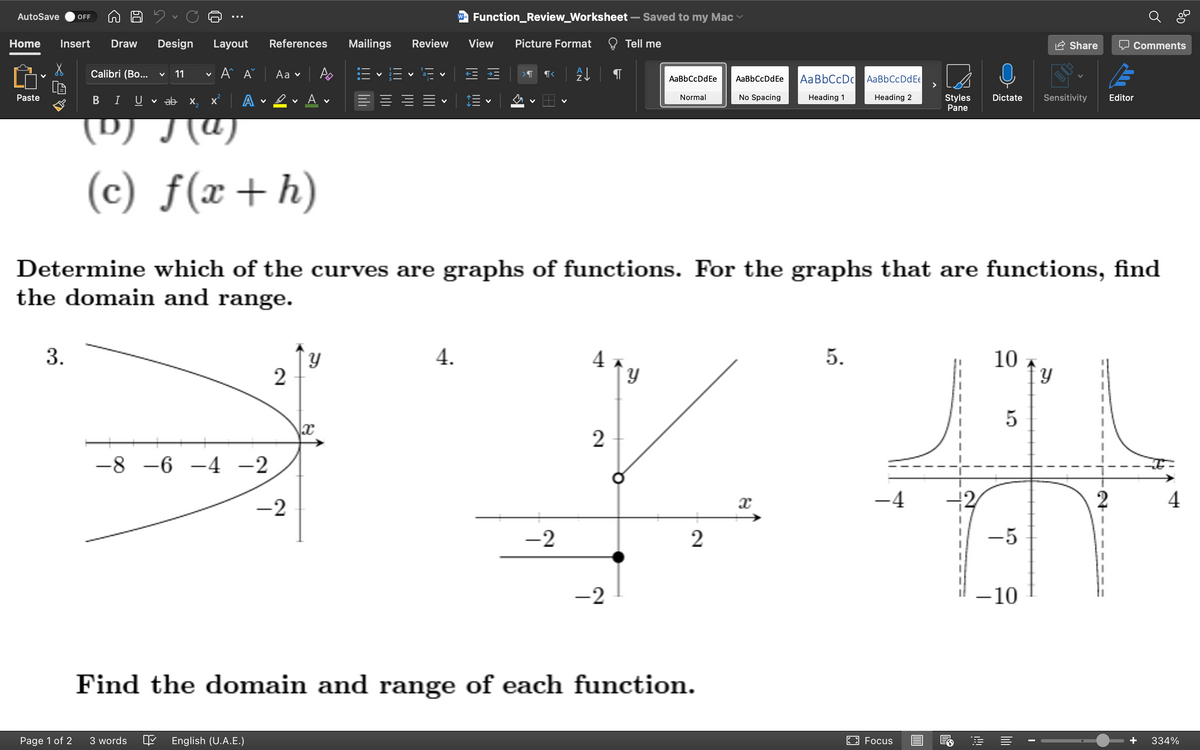
Determine which of the curves are graphs of functions. For the graphs that are functions, find the domain and range. 3. 4. 5. 10 2 5 2 -8 -6 -4 -2 -4 4 -2 -2 2 -5 -2 10 Find the domain and range of each function.


Q: 2+t-15 4. r(t) = t-8 21-71 5. g(l) = 12+21-5
A: Given - The function rt = t2 + t - 15t - 8 and gl = 2l2 - 7ll2 + 2l - 5 To find - Where the given…
Q: Find the domain and range of the function graphed below. -5 -4 -3 -2 -1 I A 3 4 5 -2 =3 -4- -5+…
A:
Q: Find the domain and range of the function graphed below. -5 -4 -3 2 -1 1 2 3 -2- 4- Domain: Range:…
A:
Q: Determine whether the graph shown to the right represents a function. Ay Choose the correct answer…
A: Solution From the given graph if we draw vertical lines on the given graph We get the graph like…
Q: Find the domain and range of the function graphed below. 5t -5 -4 -3 -2 -1 2 3 4 5 -2 -4 -5+ Domain:…
A: Given data÷
Q: The following graph approximates the number of pharmacists in a country in the years from 2002…
A: We find the number of pharmacists in a country in 2006 was approximately ----- thousands.
Q: .h(x) = 2*+2
A: First we need to draw it's graph:
Q: Q4) A- Graph the following functions and determine (domain, range): (1) y=2-√√x-1 (2) x²+1/ 3x³- 7x²…
A:
Q: Which graph represents this function? y 3. 0.5 4 1.5 6. 2 7 B 81 8' 6 6. 4 4 4 2 8 -6 -4 -10 4. 6 -4…
A:
Q: Use the picture below (on the left) and the function f(x) = ab* to a. Which graph has the largest…
A: As per as our guidelines i am supposed to answer only 1 question with its 3 subparts only .So please…
Q: f(x) = |x| – 2
A:
Q: The graph shown most accurately represents which of the following functions? 6. 7 9. 5 7 8 9
A:
Q: re) = t-5, (글 32)
A: Find the slope of the graph of the function at the given point. The given function is ft=t-5, 12,32.…
Q: 15 12 6- 6. 3 -5-4 -3 -2 -1 0 1 2 3 4 5
A:
Q: Make a table and graph for the following function: y-x-2 a) In a sentence wrlte the x-values and the…
A:
Q: Use the graph of the function to find the indicated values. 2 2 -2- -4- Provide your answer below:…
A: The y-intercept is the point at which the graph crosses the y-axis.
Q: Graph the pair of functions on the same plane. Use a dashed line for g(x). 6) f(x) = x2 , g(x) = x2…
A:
Q: ■ Find an expression for the function whose graph is the given curve.. The line segment joining the…
A: Line segment joining the points 1, -3 & 5, 7.
Q: Graph the Piecewise Function. 3x-2, if s 1 f(x) = x+2, if x> 1 Click this Coordinate Plane to draw…
A:
Q: Consider the function with the graph below. 1le 1,0 -6 6 -6 (Click on graph to enlarge) What is the…
A: Domain is the set of values of x for which function is defined. Range is the set of values of y…
Q: Grace wants to collect data on the weight of her puppy as it grows. She decides to construct a table…
A: Let's find.
Q: The function h(t) represents the rate at which people are joining a social distance line outside a…
A: Hey, since there are multiple subparts posted, we will answer first 3 questions. If you want any…
Q: Find the domain and range of the function graphed below. 13 2 7 -5 -4 -3 -2 -1 -1 -2 -3 -4 -5 +…
A: From the given figure it is clearly observed that, the function defined only when -1≤x<2.…
Q: Which function is shown in the graph? 4 2 -4-2 2. 4 O A. f(x) = |x| f(x) = x| %3D S-, if a 0 f(x) =…
A:
Q: Write a function in any form that would match the graph shown below. y 20 16 12 8 -10 -8 -6 -4 -2 4…
A: From the graph we can see that the vertex is, h, k=1, 8 Therefore equation is, x-h2=4py-k⇒x-12=4py-8…
Q: Write the function that matches the graph. 10 9 8 4 1 -10 -9 -8 -7 -6 -5 -4 -3 -2 -1 1 6. 9 10 -1 -2…
A:
Q: Write the function that matches the graph. 10 8 6. 1 -10 -9 -8 -7 -6 -5 -4 -3 -2 -1 3 6. 1 4 5 7 -1…
A: Given: Logarithmic Graph is given
Q: For this item, select the answers from the drop-down menus. Consider the functions f (x) and g (x).…
A:
Q: Write a function in any form that would match the graph shown below. y 50 40 30 20 10 -10 -8 -6 -4…
A: Given: The objective is to write a function for the given graph.
Q: Graph the pair of functions on the same plane. Use a dashed line for g(x). 6) f(x) = x2, g(x) = x2 -…
A:
Q: 3. Is the graph shown below that of a function? x uis -7-6 -5 -4 -3 -2 -1 0 1 2 4 5 7. Answer: no
A: Solution:- Since sin(0)= 0 Sin(π/2)= sin( 1.57)=1 Sin(-π/2)= -1
Q: Complete the table of values for the following function and then plot the points to graph the…
A:
Q: Find the domain and range of the function graphed below. -5 -4 -3 -2 -1 3 4 5 -2 -4 Domain: Range:…
A: Domain set of all input values where function defined Range set of all output values
Q: Find the domain and range of the function graphed below. 5+ 3 -5 -4 -3 2 1 2 3 4 5 Domain: Range: ON…
A:
Q: Determine the domain and the range of the given graph of a function. Ay 10 10
A:
Q: Which of the following functions creates the graph shown? (-x/2, 4) (5л/2, 4) 5.
A: The given graph is:
Q: Complete the equation for the piecewise function graphed below. up -7 -6 -5 -3 -7 1 2 3 4 { if – 6 <…
A: To find the function.
Q: The graph off (x) is shown. Which graph would best represent the graph of f'(x)? 54 3-2 1 1 2 3 4 5…
A:
Q: Determine if the graph is a graph of a function. If so, is it one-to-one? y 10- 8+ 6+ 4+ -10 -8 6 -4…
A: A function is a relation from a set of inputs to a another set of possible outputs where each input…
Q: Graph the function by setting the moving points correctly. Provide your answer below: -10 -5 (-3,0)…
A:
Q: Write an equation for a function that has a graph with the given characteristics. The shape of y =…
A:
Q: The graph of f(x) is shown below. Which would be an estimate for f'(4) a. -10 b. 10 C. 20 d. 20 f(x)…
A: f(x) is decreasing function at x=4.
Q: (22,4) (35,4) 4 (T1|2) 2 10 20 30 40 Age E.
A: We have to create a piecewise function from given figure
Q: Write the function to match the graph. 10 9 5 4 3 -10 -9 -8 -7 -6 -5 -4 -3 2 -1 4 6. 8 9 10 -2 -3 -4…
A:
Q: Lamar is driving to New York City. Suppose that the remaining distance to drive (in miles) is a…
A:
Q: Match each function with its graph. Write the letter corresponding to the correct answer on the line…
A:
Q: +► x 2 3 -3-2-1 -3-
A: We can check by vertical line test.. Vertical line test :-The vertical line test can be used to…
Q: Find the domain and range of the function using the graph below. 6+ 4 1 2 3 4 5 6 7 8 9 10 11 12 13…
A:
Q: find the damain.and the range and sketch the graph a F each. the fallowing Function? Q 2メ+3 iF メソー!
A:
Q: Given the graph of the function, what is the value of f(1)? Blank 1 7. 3. -2 -1 -1
A:
Determine which of the curves are graphs of functions. For the graphs that are functions, find the domain and range.

Step by step
Solved in 2 steps with 1 images

- How can we classify experimental designs? Explain one in eachcategory.The article “Determination of Most RepresentativeSubdivision” (J. of Energy Engr., 1993: 43–55) gavedata on various characteristics of subdivisions that couldbe used in deciding whether to provide electrical powerusing overhead lines or underground lines. Here are thevalues of the variable x 5 total length of streets within asubdivision:1280 5320 4390 2100 1240 3060 47701050 360 3330 3380 340 1000 9601320 530 3350 540 3870 1250 2400960 1120 2120 450 2250 2320 24003150 5700 5220 500 1850 2460 58502700 2730 1670 100 5770 3150 1890510 240 396 1419 2109a. Construct a stem-and-leaf display using the thousandsdigit as the stem and the hundreds digit as theleaf, and comment on the various features of thedisplay.b. Construct a histogram using class boundaries 0, 1000,2000, 3000, 4000, 5000, and 6000. What proportion of subdivisions have total length less than 2000?Between 2000 and 4000? How would you describethe shape of the histogram?The file MidCity Download MidCitycontains data on 128 recent sales in Mid City. For each sale, the file shows the neighborhood (1, 2, or 3) in which the house is located, the number of offers made on the house, the square footage, whether the house is made primarily of brick, the number of bathrooms, the number of bedrooms, and the selling price. Neighborhoods 1 and 2 are more traditional neighborhoods, whereas neighborhood 3 is a newer, more prestigious neighborhood. Part A) Do buyers pay a premium for a brick house, all else being equal? Use one Excel spreadsheet labeled Prob3a to show your work for this problem. Part B) Is there a premium for a house in neighborhood 3, all else being equal? Use one Excel spreadsheet labeled Prob3b to show your work for this problem. Home Nbhd Offers Sq Ft Brick Bedrooms Bathrooms Price 1 2 2 1790 No 2 2 228600 2 2 3 2030 No 4 2 228400 3 2 1 1740 No 3 2 229600 4 2 3 1980 No 3 2 189400 5 2 3 2130 No 3 3 239600 6 1 2 1780 No 3 2 229200…
- *Please work with your version, don't copy from other sources use table t in doing it 1. A testing engineer is stress testing an Application Programming Interface (API) made by his company on twenty servers from two different vendors. The maximum number of hits from each server from each vendor is as follows (in thousands):Server Vendor A: 42.1 ; 41.3 ; 42.4 ; 43.2 ; 41.8 ; 41.0 ; 41.8 ; 42.8 ; 42,3 ; 42.7Server Vendor B: 42.7 ; 43.8 ; 42.5 ; 43.1 ; 44.0 ; 43.6 ; 43.3 ; 43.5 ; 41.7 ; 44.1It is known that the two stress test data are normally distributed with the same variance.a. Compute the 99% two-sided confidence interval for the difference in the mean number of hits from the servers of the two vendors.b. Compute the 97.5% upper confidence interval (97.5% upper confidence interval) for the difference in the average number of hits from the servers of the two vendors.c. Compute a lower confidence interval of 90% for the difference in the average number of hits from the servers of the…The file MidCity Download MidCitycontains data on 128 recent sales in Mid City. For each sale, the file shows the neighborhood (1, 2, or 3) in which the house is located, the number of offers made on the house, the square footage, whether the house is made primarily of brick, the number of bathrooms, the number of bedrooms, and the selling price. Neighborhoods 1 and 2 are more traditional neighborhoods, whereas neighborhood 3 is a newer, more prestigious neighborhood. Home Nbhd Offers Sq Ft Brick Bedrooms Bathrooms Price 1 2 2 1790 No 2 2 228600 2 2 3 2030 No 4 2 228400 3 2 1 1740 No 3 2 229600 4 2 3 1980 No 3 2 189400 5 2 3 2130 No 3 3 239600 6 1 2 1780 No 3 2 229200 7 3 3 1830 Yes 3 3 303200 8 3 2 2160 No 4 2 301400 9 2 3 2110 No 4 2 238400 10 2 3 1730 No 3 3 208000 11 2 3 2030 Yes 3 2 265000 12 2 2 1870 Yes 2 2 246000 13 1 4 1910 No 3 2 205200 14 1 5 2150 Yes 3 3 252600 15 3 4 2590 No 4 3 353600 16 3 1 1780 No 4 2 291600 17 2 4 2190 Yes 3 3…The exercise involving data in this and subsequent sections were designed to be solved using Excel. Johnson Filtration, Inc. provides maintenance service for water-filtration systems. Suppose that in addition to information on the number of months since the machine was serviced and whether a mechanical or an electrical repair was necessary, the managers obtained a list showing which repairperson performed the service. The revised data follow. Repair Time(hours) Months SinceLast Service Type ofRepair Repairperson 2.9 2 electrical Dave Newton 3.0 6 mechanical Dave Newton 4.8 8 electrical Bob Jones 1.8 3 mechanical Dave Newton 2.9 2 electrical Dave Newton 4.9 7 electrical Bob Jones 4.2 9 mechanical Bob Jones 4.8 8 mechanical Bob Jones 4.4 4 electrical Bob Jones 4.5 6 electrical Dave Newton Ignore for now the months since the last maintenance service (x1 ) and the repairperson…
- A research company has designed three different systems to clean up oil spillages. The following table contains the results, measured by how much surface area (in square meters) is cleared in 1 hour. The data were found by testing each method in several trials. Is there any significant difference in the testing of effectiveness of the three systems? Use the 0.05 level of significance. System A System B System C 293 295 304 298 291 290 301 302 299 294 287 295 297 300 - 293 - -In a 1996 article published in Technometrics, 38, pp. 11–22, the authors discuss the reliability of nuclear power plant emergency generators. To control the risk of damage to the nuclear core during accidents at nuclear plants, the reliability of emergency diesel generators (EDG) to start on demand must be maintained at a very high level. At each nuclear power plant there are a number of such generators. An overall measure of reliability is obtained by counting the number of times the EDGs successfully work when needed. The table here provides the number of successful demands for implementation of an EDG between each subsequent failure in an EDG for all the EDGs at each of seven nuclear power plants. A regulatory agency wants to determine if there is a difference in the reliability of the seven nuclear power plants. (Use Data _8). Run an ANOVA (Regardless of the assumptions) and Kruskal–Wallis test.In a 1996 article published in Technometrics, 38, pp. 11–22, the authors discuss the reliability of nuclear power plant emergency generators. To control the risk of damage to the nuclear core during accidents at nuclear plants, the reliability of emergency diesel generators (EDG) to start on demand must be maintained at a very high level. At each nuclear power plant there are a number of such generators. An overall measure of reliability is obtained by counting the number of times the EDGs successfully work when needed. The table here provides the number of successful demands for implementation of an EDG between each subsequent failure in an EDG for all the EDGs at each of seven nuclear power plants. A regulatory agency wants to determine if there is a difference in the reliability of the seven nuclear power plants. (Use Data _8). Do the conditions necessary for conducting the ANOVA test appear to be satisfied by these data? Run an ANOVA (Regardless of the assumptions) and…
- In a 1996 article published in Technometrics, 38, pp. 11–22, the authors discuss the reliability of nuclear power plant emergency generators. To control the risk of damage to the nuclear core during accidents at nuclear plants, the reliability of emergency diesel generators (EDG) to start on demand must be maintained at a very high level. At each nuclear power plant there are a number of such generators. An overall measure of reliability is obtained by counting the number of times the EDGs successfully work when needed. The table here provides the number of successful demands for implementation of an EDG between each subsequent failure in an EDG for all the EDGs at each of seven nuclear power plants. A regulatory agency wants to determine if there is a difference in the reliability of the seven nuclear power plants. (Use Data _8). Do the conditions necessary for conducting the ANOVA test appear to be satisfied by these data?When looking at "Promotion X Study Deal" with (Study =1 variable indcating the respondent whose promary visit purpose is to study. Answer the following question using the chart provided. Is primary visit purpose a boundary condition? (ie: Will the effecdt of promotion deal on Lieklihood_Revisit be different between the group (Study =1) and the group (Study =0)? Use the interaction effect to answerThe aim of this prac is to practice data gathering. Assume that you have been employed to improve the user experience of an interactive product such as a smartphone app, a digital media player, a Blu-ray player, computer software, or some other type of technology (you choose anything you can easily observe with the people around you). This existing product may be redesigned, or a completely new product may be created. To do the assignment, find a group of people or a single individual prepared to be the user group. These could be your family, friends, peers, or people in a local community group. For this assignment: Identify the product here: [1] Clarify the basic goal of improving the product by considering what this means in your circumstances. Watch the group (or person) casually to get an understanding of any issues that might create challenges for this activity and any information to help refine the study goals. [3] Explain how you would use each of the three data gathering…