Develop a frequency distribution for the variable "Yearly Salary." Start with your Bin with 40,000 and increment it by 15,000 up to 130,000
Develop a frequency distribution for the variable "Yearly Salary." Start with your Bin with 40,000 and increment it by 15,000 up to 130,000

A First Course in Probability (10th Edition)
10th Edition
ISBN:9780134753119
Author:Sheldon Ross
Publisher:Sheldon Ross
Chapter1: Combinatorial Analysis
Section: Chapter Questions
Problem 1.1P: a. How many different 7-place license plates are possible if the first 2 places are for letters and...

Related questions
Question
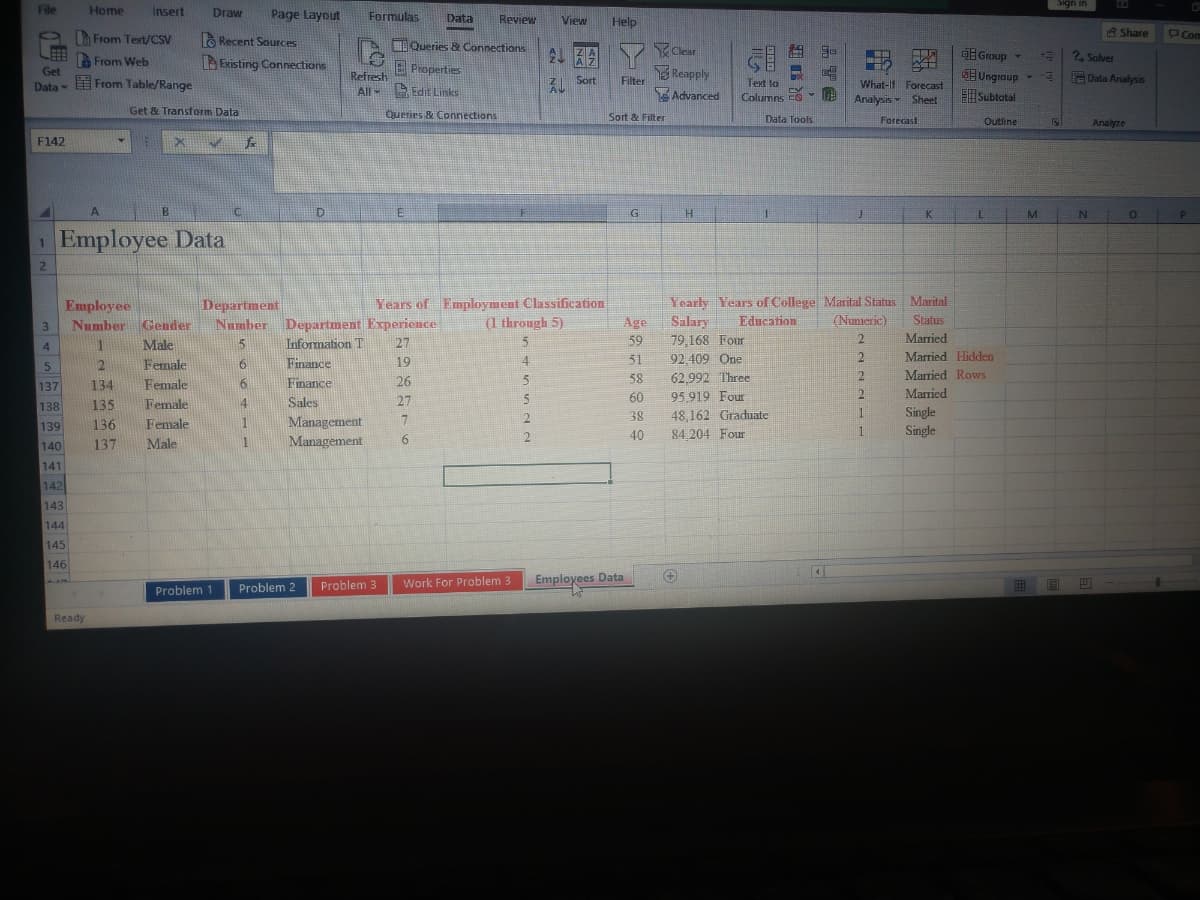
Develop a frequency distribution for the variable "Yearly Salary." Start with your Bin with 40,000 and increment it by 15,000 up to 130,000
Transcribed Image Text:Sign in
File
Home
Insert
Draw
Page Layout
Formulas
Data
Review
View
Help
From Text/CSV
O Recent Sources
A Share
PCom
EQueries & Connections
Clear
E Group
2 Solver
Get
-
From Web
Existing Connections
E Properties
Reapply
Filter
Refresh
All - Edit Links
E
Ungraup -
From Table/Range
Data Analysis
Data
Sort
Text to
What-If Forecast
Advanced
Columns A
战,
Analysis Sheet
E Subtotal
Get & Transform Data
Queries & Connections
Sort & Filter
Data Tools
Forecast
Outline
Analyze
F142
B.
D
G
H
K
Employee Data
1.
2
Yearly Years of College Marital Status Marital
Employee
Number Gender
Male
Department
Number Department Experience
Years of Employment Classification
(1 through 5)
Age
Salary
Education
(Numeric)
Status
3
Married
79,168 Four
92,409 One
Information T
27
59
2
4
Married Hidden
Married Rows
5
Female
Finance
19
4
51
Female
Finance
26
5.
58
62,992 Three
137
134
Sales
60
95 919 Four
Маried
138
135
Female
14
27
Single
Single
38
48,162 Graduate
1
139
136
Female
1
Management
2.
40
84.204 Four
1
137
Male
1
Management
6.
140
141
142
142
143
144
145
146
Work For Problem 3
Employees Data
Problem 2
Problem 3
Problem 1
Ready
Expert Solution
This question has been solved!
Explore an expertly crafted, step-by-step solution for a thorough understanding of key concepts.

This is a popular solution!

Trending now
This is a popular solution!

Step by step
Solved in 2 steps

Knowledge Booster


Learn more about
Need a deep-dive on the concept behind this application? Look no further. Learn more about this topic, probability and related others by exploring similar questions and additional content below.Recommended textbooks for you
A First Course in Probability (10th Edition)
Probability
ISBN:
9780134753119
Author:
Sheldon Ross
Publisher:
PEARSON

A First Course in Probability (10th Edition)
Probability
ISBN:
9780134753119
Author:
Sheldon Ross
Publisher:
PEARSON