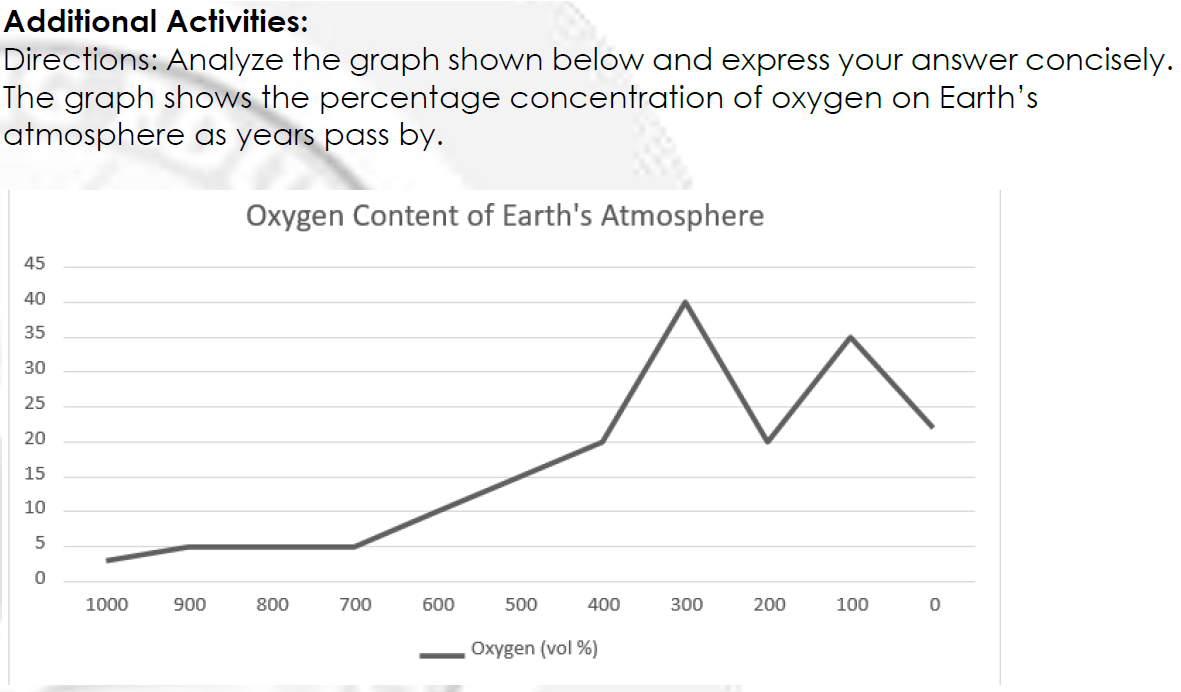
Directions: Analyze the graph shown below and express your answer concisely. The graph shows the percentage concentration of oxygen on Earth's atmosphere as years pass by.
Directions: Analyze the graph shown below and express your answer concisely. The graph shows the percentage concentration of oxygen on Earth's atmosphere as years pass by.

Biology Today and Tomorrow without Physiology (MindTap Course List)
5th Edition
ISBN:9781305117396
Author:Cecie Starr, Christine Evers, Lisa Starr
Publisher:Cecie Starr, Christine Evers, Lisa Starr
Chapter18: The Biosphere And Human Effects
Section: Chapter Questions
Problem 8SQ

Related questions

Question
The numbers of the bottom of the chart represents the number of years. What do you think is/are the reasons on the rise and decline of oxygen levels on earth as years go by?
Transcribed Image Text:Additional Activities:
Directions: Analyze the graph shown below and express your answer concisely.
The graph shows the percentage concentration of oxygen on Earth's
atmosphere as years pass by.
Oxygen Content of Earth's Atmosphere
45
40
35
30
25
20
15
10
1000
900
800
700
600
500
400
300
200
100
Oxygen (vol %)
Expert Solution
This question has been solved!
Explore an expertly crafted, step-by-step solution for a thorough understanding of key concepts.

This is a popular solution!

Trending now
This is a popular solution!

Step by step
Solved in 2 steps

Knowledge Booster


Learn more about
Need a deep-dive on the concept behind this application? Look no further. Learn more about this topic, biology and related others by exploring similar questions and additional content below.Recommended textbooks for you
Biology Today and Tomorrow without Physiology (Mi…
Biology
ISBN:
9781305117396
Author:
Cecie Starr, Christine Evers, Lisa Starr
Publisher:
Cengage Learning
Biology Today and Tomorrow without Physiology (Mi…
Biology
ISBN:
9781305117396
Author:
Cecie Starr, Christine Evers, Lisa Starr
Publisher:
Cengage Learning