Dr. Lorenzo finds that his patients' heart rates are normally distributed, with an average of 69 beats per minute and with a standard deviation of 6 beats per minute. He then graphs the normal curve as seen to the right. Label the tick marks on the x-axis of the normal curve. a = b = 57 C= d = 87 b d e e = 63 f= 51 g = 81 69 60
Dr. Lorenzo finds that his patients' heart rates are normally distributed, with an average of 69 beats per minute and with a standard deviation of 6 beats per minute. He then graphs the normal curve as seen to the right. Label the tick marks on the x-axis of the normal curve. a = b = 57 C= d = 87 b d e e = 63 f= 51 g = 81 69 60

Glencoe Algebra 1, Student Edition, 9780079039897, 0079039898, 2018
18th Edition
ISBN:9780079039897
Author:Carter
Publisher:Carter
Chapter10: Statistics
Section: Chapter Questions
Problem 22SGR

Related questions
Topic Video
Question
100%
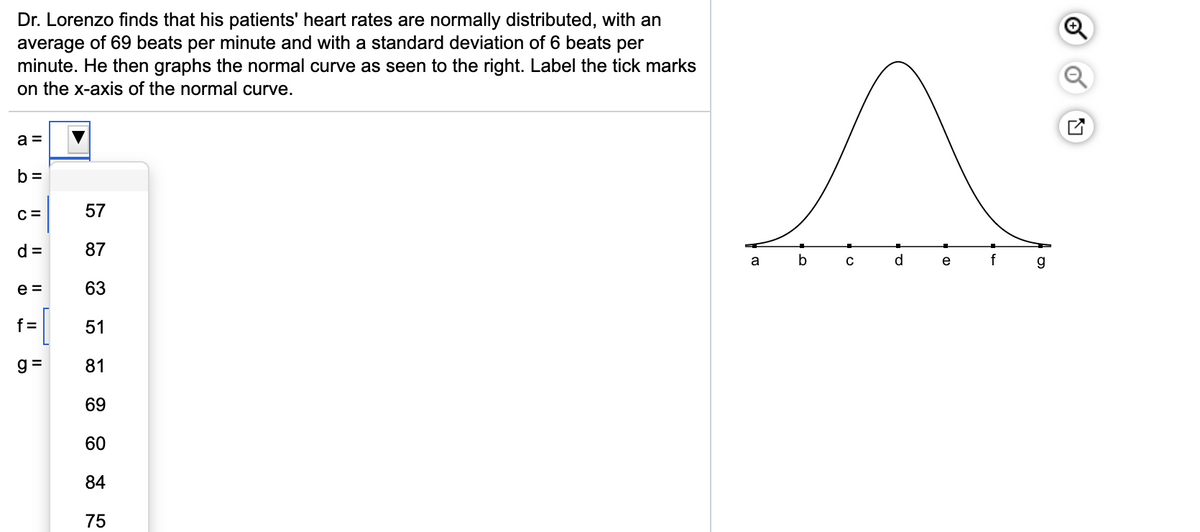
Transcribed Image Text:Dr. Lorenzo finds that his patients' heart rates are normally distributed, with an
average of 69 beats per minute and with a standard deviation of 6 beats per
minute. He then graphs the normal curve as seen to the right. Label the tick marks
on the x-axis of the normal curve.
a =
b =
C =
57
d =
87
a
b
d
e
e =
63
f =
51
g =
81
69
60
84
75
Expert Solution
This question has been solved!
Explore an expertly crafted, step-by-step solution for a thorough understanding of key concepts.

This is a popular solution!

Trending now
This is a popular solution!

Step by step
Solved in 2 steps

Knowledge Booster


Learn more about
Need a deep-dive on the concept behind this application? Look no further. Learn more about this topic, probability and related others by exploring similar questions and additional content below.Recommended textbooks for you
Glencoe Algebra 1, Student Edition, 9780079039897…
Algebra
ISBN:
9780079039897
Author:
Carter
Publisher:
McGraw Hill
Glencoe Algebra 1, Student Edition, 9780079039897…
Algebra
ISBN:
9780079039897
Author:
Carter
Publisher:
McGraw Hill