Draw the graph of the following sinusoidal function over the indicated interval. For this graph, • State the t-intercepts on the given interval. • State the y-intercept. • State the maximum value of the function and the t-coordinates of all the points where the maximum Occurs. State the minimum value of the function and the t-coordinates of all the points where the minimum value occurs. y = 5 cos(t) with -
Draw the graph of the following sinusoidal function over the indicated interval. For this graph, • State the t-intercepts on the given interval. • State the y-intercept. • State the maximum value of the function and the t-coordinates of all the points where the maximum Occurs. State the minimum value of the function and the t-coordinates of all the points where the minimum value occurs. y = 5 cos(t) with -

Algebra & Trigonometry with Analytic Geometry
13th Edition
ISBN:9781133382119
Author:Swokowski
Publisher:Swokowski
Chapter5: Inverse, Exponential, And Logarithmic Functions
Section5.6: Exponential And Logarithmic Equations
Problem 64E

Related questions
Question
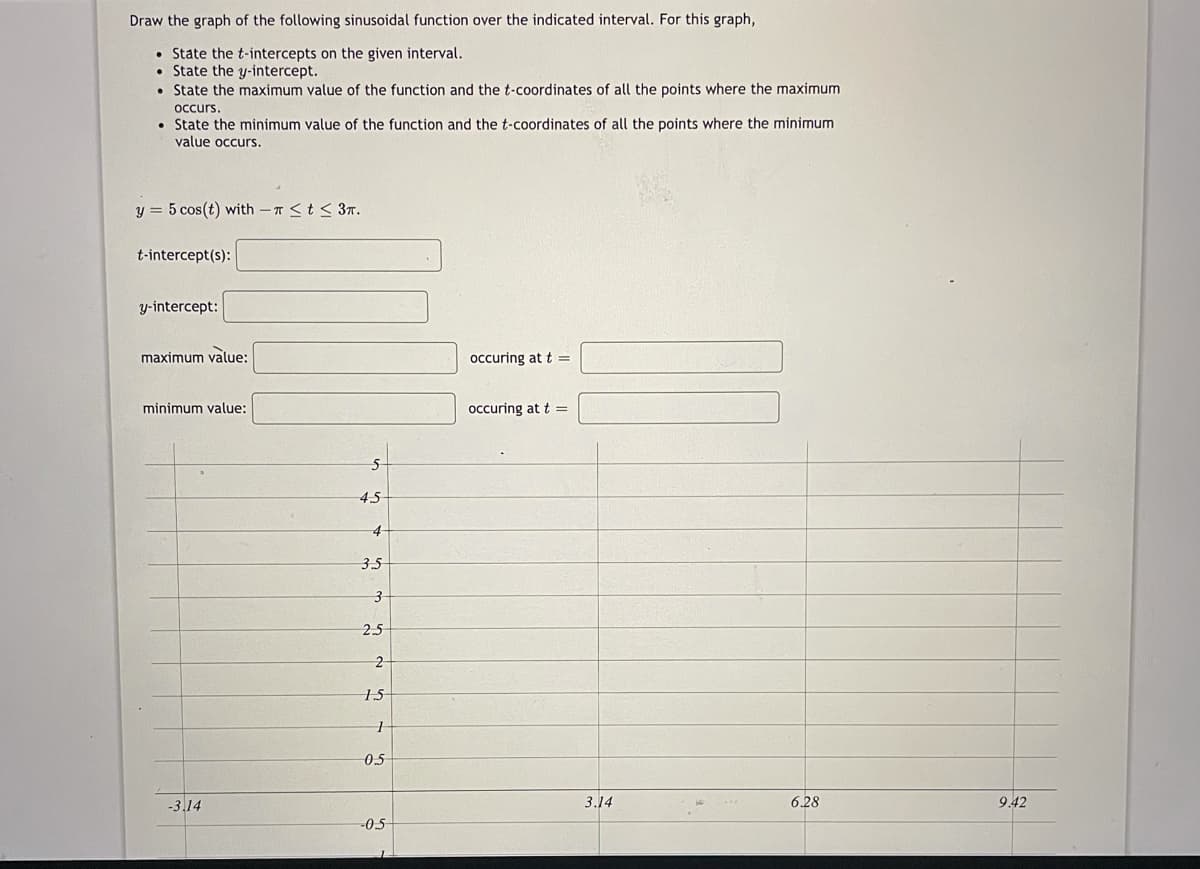
Transcribed Image Text:Draw the graph of the following sinusoidal function over the indicated interval. For this graph,
• State the t-intercepts on the given interval.
• State the y-intercept.
• State the maximum value of the function and the t-coordinates of all the points where the maximum
occurs.
• State the minimum value of the function and the t-coordinates of all the points where the minimum
value occurs.
y = 5 cos(t) with -T <t < 3T.
t-intercept(s):
y-intercept:
maximum value:
occuring at t =
minimum value:
occuring at t =
45
3.5
2.5
2
15
05
-3.14
3.14
6.28
9.42
-0.5
Expert Solution
This question has been solved!
Explore an expertly crafted, step-by-step solution for a thorough understanding of key concepts.

Step by step
Solved in 4 steps with 1 images

Recommended textbooks for you
Algebra & Trigonometry with Analytic Geometry
Algebra
ISBN:
9781133382119
Author:
Swokowski
Publisher:
Cengage
Algebra & Trigonometry with Analytic Geometry
Algebra
ISBN:
9781133382119
Author:
Swokowski
Publisher:
Cengage