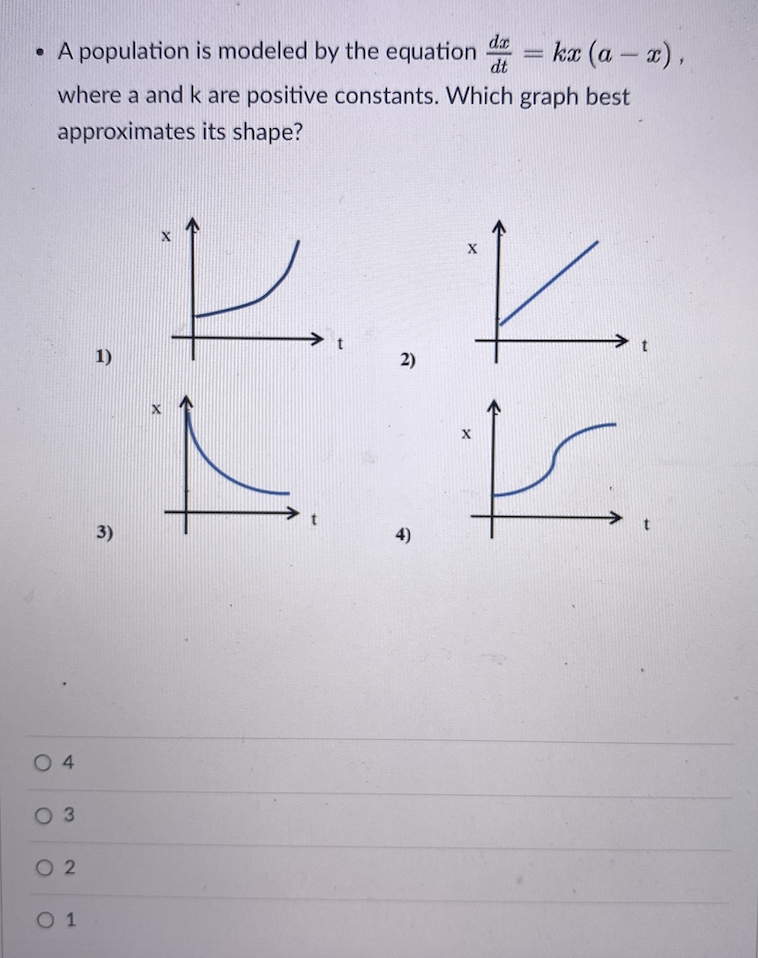
dx • A population is modeled by the equation dt ka (a – x), %3D where a and k are positive constants. Which graph best approximates its shape? 1) 2) 3) 4)
dx • A population is modeled by the equation dt ka (a – x), %3D where a and k are positive constants. Which graph best approximates its shape? 1) 2) 3) 4)

Linear Algebra: A Modern Introduction
4th Edition
ISBN:9781285463247
Author:David Poole
Publisher:David Poole
Chapter4: Eigenvalues And Eigenvectors
Section4.6: Applications And The Perron-frobenius Theorem
Problem 69EQ: Let x=x(t) be a twice-differentiable function and consider the second order differential equation...

Related questions
Question
Transcribed Image Text:dx
• A population is modeled by the equation
kæ (a – x),
dt
where a and k are positive constants. Which graph best
approximates its shape?
1)
2)
3)
4)
O 4
0 3
O 2
O 1
Expert Solution
This question has been solved!
Explore an expertly crafted, step-by-step solution for a thorough understanding of key concepts.

Step by step
Solved in 3 steps

Recommended textbooks for you
Linear Algebra: A Modern Introduction
Algebra
ISBN:
9781285463247
Author:
David Poole
Publisher:
Cengage Learning
Linear Algebra: A Modern Introduction
Algebra
ISBN:
9781285463247
Author:
David Poole
Publisher:
Cengage Learning