e hundred twenty two people who grew up in either City A or City B were surveyed to determine whether they preferred country music or blues (both and neither e not acceptable responses), Of those who grew up in City B. 36 preferred blues and 33 prefemed country music. Of those who grew up in City A 29 preferred ntry. Answer parts (a) through (d) below. Complete the two-way table summarizing the reviews. Country Music Blues City A 29 24 City B 33 36 (Type whole numbers.). Make a Venn diagram from the table in part (a). Choose the correct answer below. City B Country City B NCominry Country Cin Counry 36 24 33 How many City A residents preferred country? 9 (Type a whole number) How many respondents preferred country?
e hundred twenty two people who grew up in either City A or City B were surveyed to determine whether they preferred country music or blues (both and neither e not acceptable responses), Of those who grew up in City B. 36 preferred blues and 33 prefemed country music. Of those who grew up in City A 29 preferred ntry. Answer parts (a) through (d) below. Complete the two-way table summarizing the reviews. Country Music Blues City A 29 24 City B 33 36 (Type whole numbers.). Make a Venn diagram from the table in part (a). Choose the correct answer below. City B Country City B NCominry Country Cin Counry 36 24 33 How many City A residents preferred country? 9 (Type a whole number) How many respondents preferred country?

Glencoe Algebra 1, Student Edition, 9780079039897, 0079039898, 2018
18th Edition
ISBN:9780079039897
Author:Carter
Publisher:Carter
Chapter10: Statistics
Section10.5: Comparing Sets Of Data
Problem 26PFA

Related questions
Question
100%
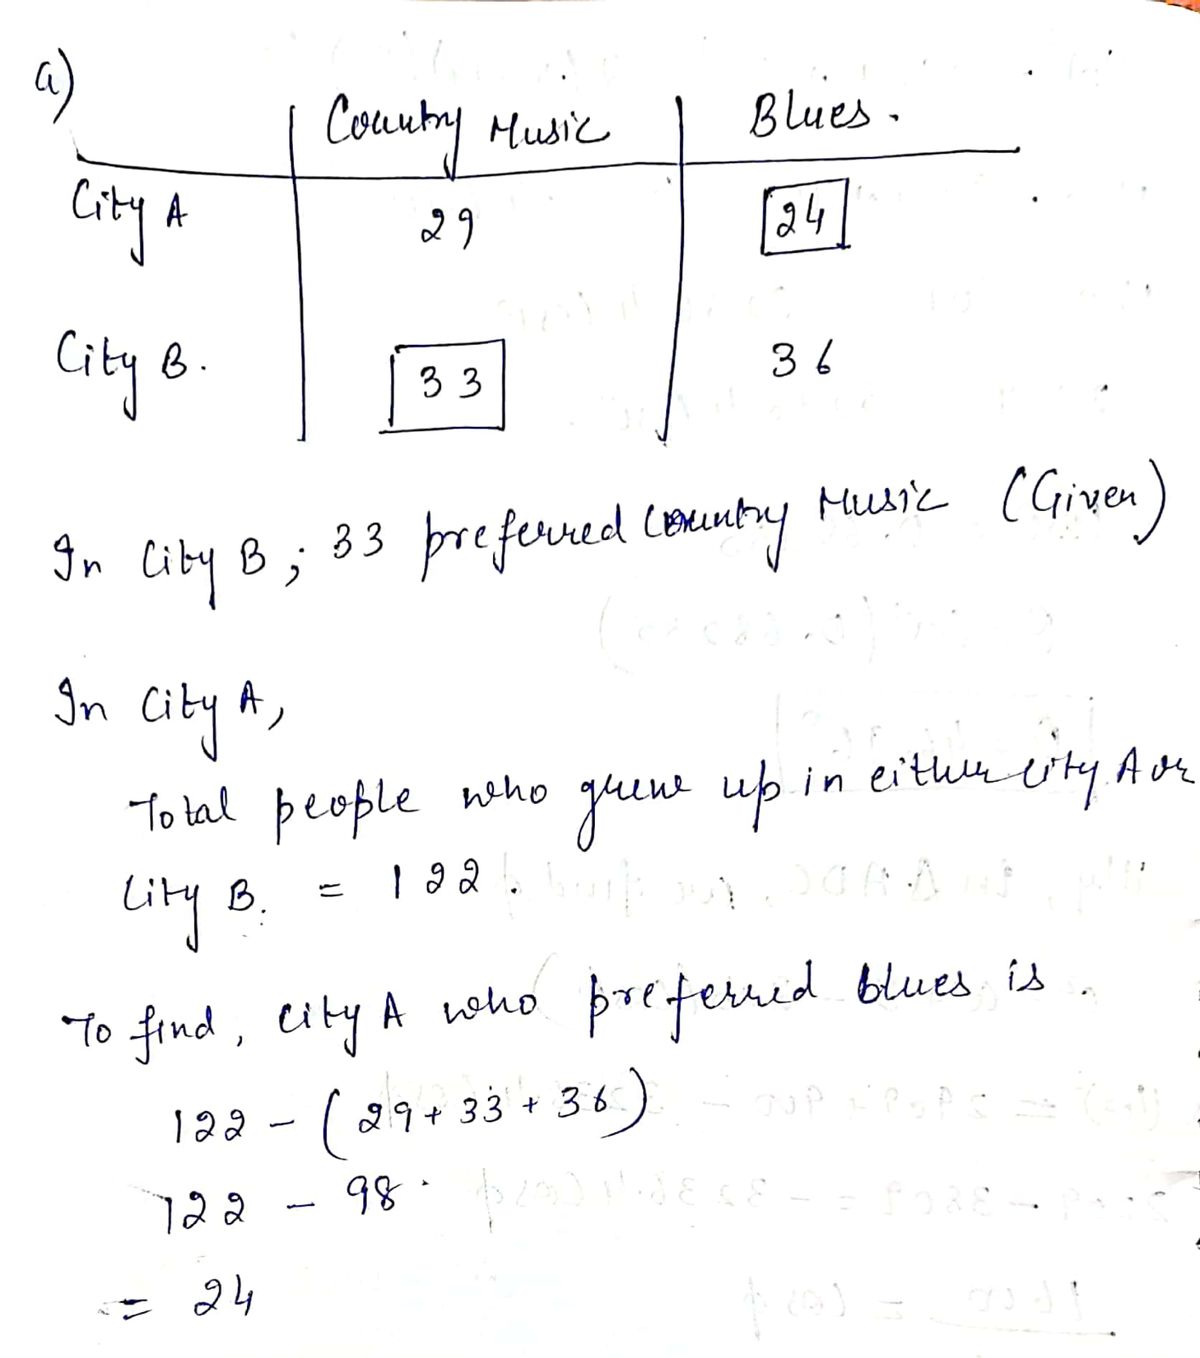
How did they came to this number?
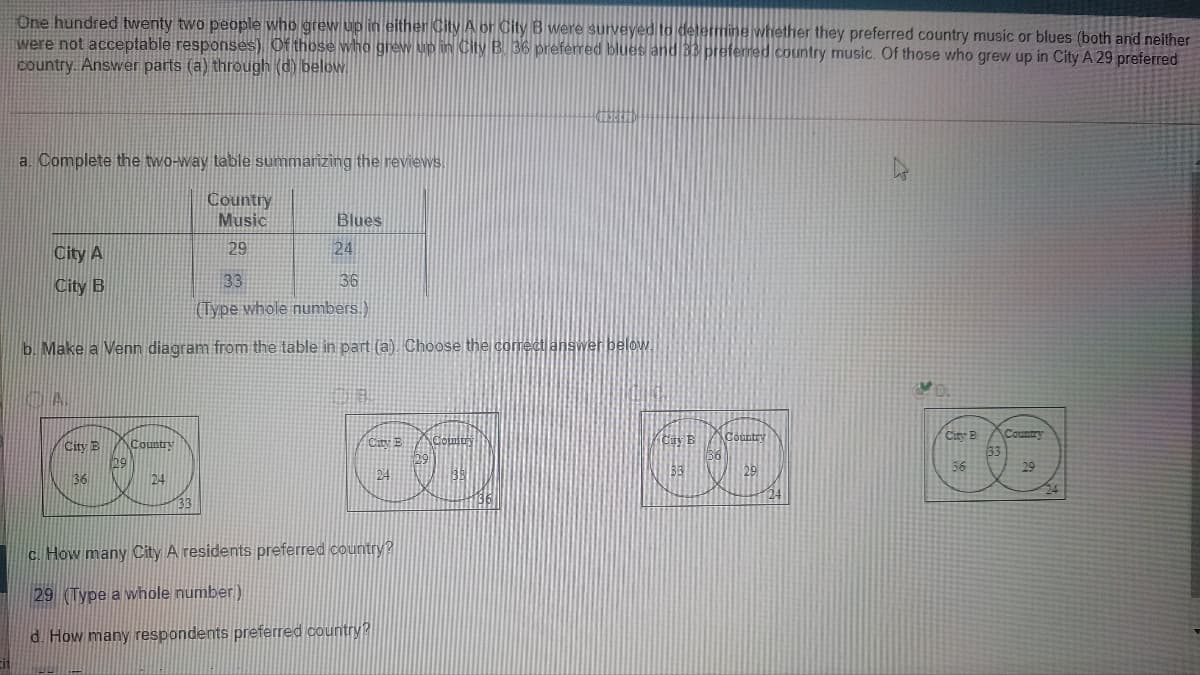
Transcribed Image Text:One hundred twenty two people who grew up in either CityA or City B were surveyed to determine whether they preferred country music or blues (both and neither
were not acceptable responses). Of those who grew up in City B. 36 preferred blues and 33 preferred country music. Of those who grew up in City A 29 preferred
country. Answer parts (a) through (d) below.
a. Complete the two-way table summarizing the reviews.
Country
Music
Blues
City A
29
24
City B
33
36
(Type whole numbers.)
b. Make a Venn diagram from the table in part (a). Choose the comect answer below.
Country
Ciry B
Counry
City B
29
Country
33
29
36
29
36
24
24
24
c. How many City A residents preferred country?
29 (Type a whole number)
d. How many respondents preferred country?
Expert Solution
Step 1

Trending now
This is a popular solution!

Step by step
Solved in 3 steps with 3 images

Recommended textbooks for you
Glencoe Algebra 1, Student Edition, 9780079039897…
Algebra
ISBN:
9780079039897
Author:
Carter
Publisher:
McGraw Hill

Functions and Change: A Modeling Approach to Coll…
Algebra
ISBN:
9781337111348
Author:
Bruce Crauder, Benny Evans, Alan Noell
Publisher:
Cengage Learning

Holt Mcdougal Larson Pre-algebra: Student Edition…
Algebra
ISBN:
9780547587776
Author:
HOLT MCDOUGAL
Publisher:
HOLT MCDOUGAL
Glencoe Algebra 1, Student Edition, 9780079039897…
Algebra
ISBN:
9780079039897
Author:
Carter
Publisher:
McGraw Hill
Functions and Change: A Modeling Approach to Coll…
Algebra
ISBN:
9781337111348
Author:
Bruce Crauder, Benny Evans, Alan Noell
Publisher:
Cengage Learning
Holt Mcdougal Larson Pre-algebra: Student Edition…
Algebra
ISBN:
9780547587776
Author:
HOLT MCDOUGAL
Publisher:
HOLT MCDOUGAL