Enrollment (in millions 2012. 15.7 15.8 16.0 16.2 16.4 16.6 16.9 17.1 17.3 17.6 11 03 04 05 06 07 08 09 10 11 12 The linear model, y = 2145x + 15.59, provides the approximate enrollment, in millions, between the years 2003 and 2012, where x = 0 corresponds to 2003, x = 1 to 2004, and so on, and y is in millions of students. nts (a) Use the model to determine projected enrollment for Fall 2008. Librar The projected enrollment for Fall 2008 is 16.7 millions. (Type an integer or decimal rounded to the nearest tenth as needed.). (b) Use the model to determine the year in which enrollment is projected to reach 17 million. Success (Round down to the nearest year.)
Enrollment (in millions 2012. 15.7 15.8 16.0 16.2 16.4 16.6 16.9 17.1 17.3 17.6 11 03 04 05 06 07 08 09 10 11 12 The linear model, y = 2145x + 15.59, provides the approximate enrollment, in millions, between the years 2003 and 2012, where x = 0 corresponds to 2003, x = 1 to 2004, and so on, and y is in millions of students. nts (a) Use the model to determine projected enrollment for Fall 2008. Librar The projected enrollment for Fall 2008 is 16.7 millions. (Type an integer or decimal rounded to the nearest tenth as needed.). (b) Use the model to determine the year in which enrollment is projected to reach 17 million. Success (Round down to the nearest year.)

Algebra & Trigonometry with Analytic Geometry
13th Edition
ISBN:9781133382119
Author:Swokowski
Publisher:Swokowski
Chapter2: Equations And Inequalities
Section2.7: More On Inequalities
Problem 44E

Related questions
Question
100%
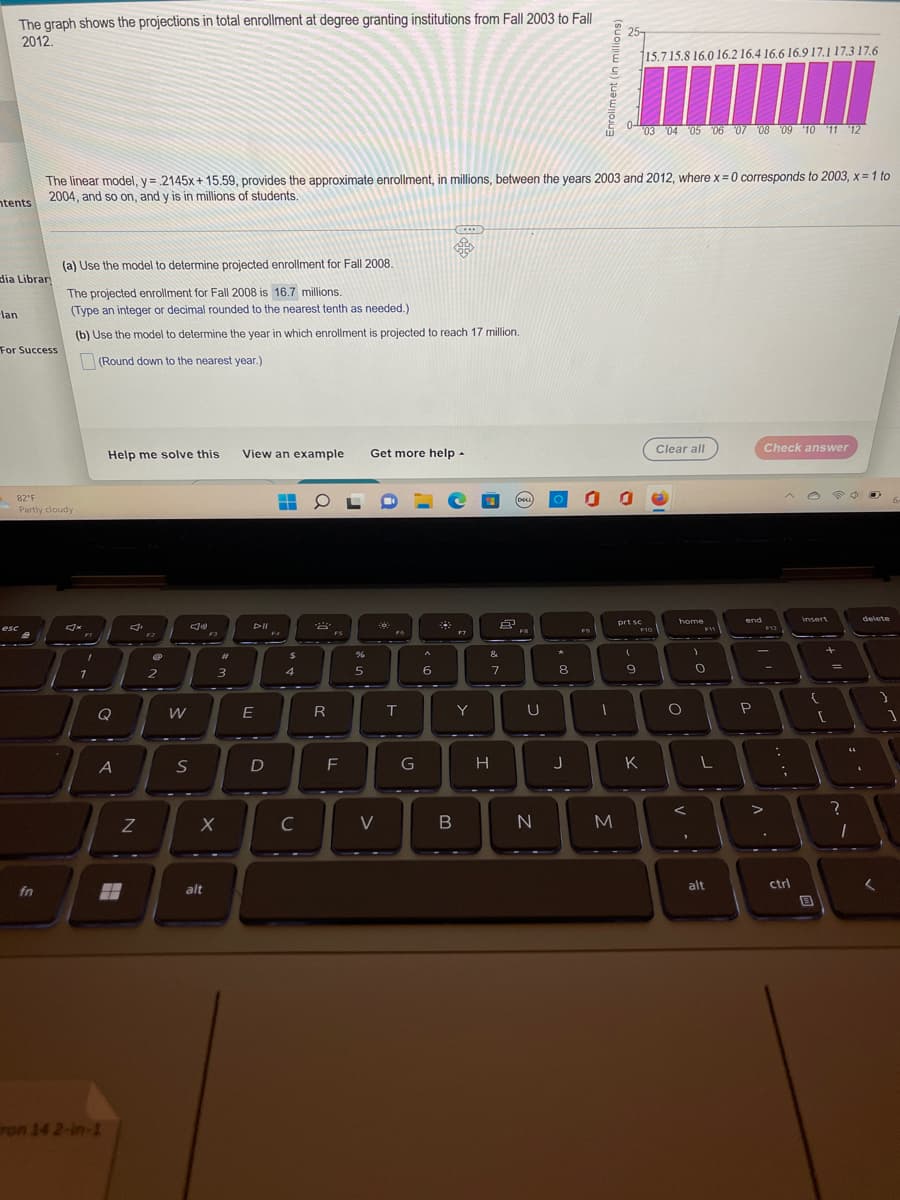
Transcribed Image Text:The graph shows the projections in total enrollment at degree granting institutions from Fall 2003 to Fall
2012.
15.7 15.8 16.0 16.2 16.4 16.6 16.9 17.1 17.3 17.6
I
0-
17
'03 04 05 06 07 08 09 10 11 12
The linear model, y = 2145x+15.59, provides the approximate enrollment, in millions, between the years 2003 and 2012, where x = 0 corresponds to 2003, x= 1 to
2004, and so on, and y is in millions of students.
ntents
(a) Use the model to determine projected enrollment for Fall 2008.
dia Librar
The projected enrollment for Fall 2008 is 16.7 millions.
lan
(Type an integer or decimal rounded to the nearest tenth as needed.)
For Success
(b) Use the model to determine the year in which enrollment is projected to reach 17 million.
(Round down to the nearest year.)
Help me solve this View an example Get more help.
Clear all
Check answer
82°F
Partly cloudy
insert
D-II
30
23
F
{
[
esc
4x
1
7
Q
A
fn
iron 14 2-in-1
H
N
2
W
S
#1
3
X
alt
E
D
F4
$
4
C
8
R
FS
F
%
5
V
F6
T
G
A
6
B
17
Y
201
&
7
H
(DELL)
2
FR
U
N
O 00
*
8
J
FO
-
prt sc
(
M
9
9
F10
K
home
F11
)
O
O
V
"
L
alt
end
P
F12
-
V
:
ctrl
44
?
1
delete
4
Expert Solution
This question has been solved!
Explore an expertly crafted, step-by-step solution for a thorough understanding of key concepts.

This is a popular solution!

Trending now
This is a popular solution!

Step by step
Solved in 3 steps with 3 images

Recommended textbooks for you
Algebra & Trigonometry with Analytic Geometry
Algebra
ISBN:
9781133382119
Author:
Swokowski
Publisher:
Cengage
Algebra & Trigonometry with Analytic Geometry
Algebra
ISBN:
9781133382119
Author:
Swokowski
Publisher:
Cengage