Enrollment in U.S. Colkges The graph shows enrollment in U.S. colleges, with projections through 2009. The function W(x) = 0.07x + 4.1 models the number of women, W(x), in millions, enrolled in U.S. colleges x years after 1984. The function M(x) = 0.01x+ 3.9 models the number of men, M(x), in millions, enrolled in U.S. colleges x years after 1984. Find and interpret W(6). Identify this information as a point on the graph for women. Women Men 2. 1980 1985 1990 1995 2000 2005 2010 Year W(6) = (Type an integer or a decimal.) W(6) can be interpreted as the following. In the year there were million women enrolled in U.S. colleges. With which point on the graph is W(6) associated? |(Type an ordered pair.) (suoiu) juaujoua
Enrollment in U.S. Colkges The graph shows enrollment in U.S. colleges, with projections through 2009. The function W(x) = 0.07x + 4.1 models the number of women, W(x), in millions, enrolled in U.S. colleges x years after 1984. The function M(x) = 0.01x+ 3.9 models the number of men, M(x), in millions, enrolled in U.S. colleges x years after 1984. Find and interpret W(6). Identify this information as a point on the graph for women. Women Men 2. 1980 1985 1990 1995 2000 2005 2010 Year W(6) = (Type an integer or a decimal.) W(6) can be interpreted as the following. In the year there were million women enrolled in U.S. colleges. With which point on the graph is W(6) associated? |(Type an ordered pair.) (suoiu) juaujoua

Trigonometry (MindTap Course List)
10th Edition
ISBN:9781337278461
Author:Ron Larson
Publisher:Ron Larson
ChapterP: Prerequisites
SectionP.7: A Library Of Parent Functions
Problem 47E

Related questions
Question
solvee
Transcribed Image Text:Next questio
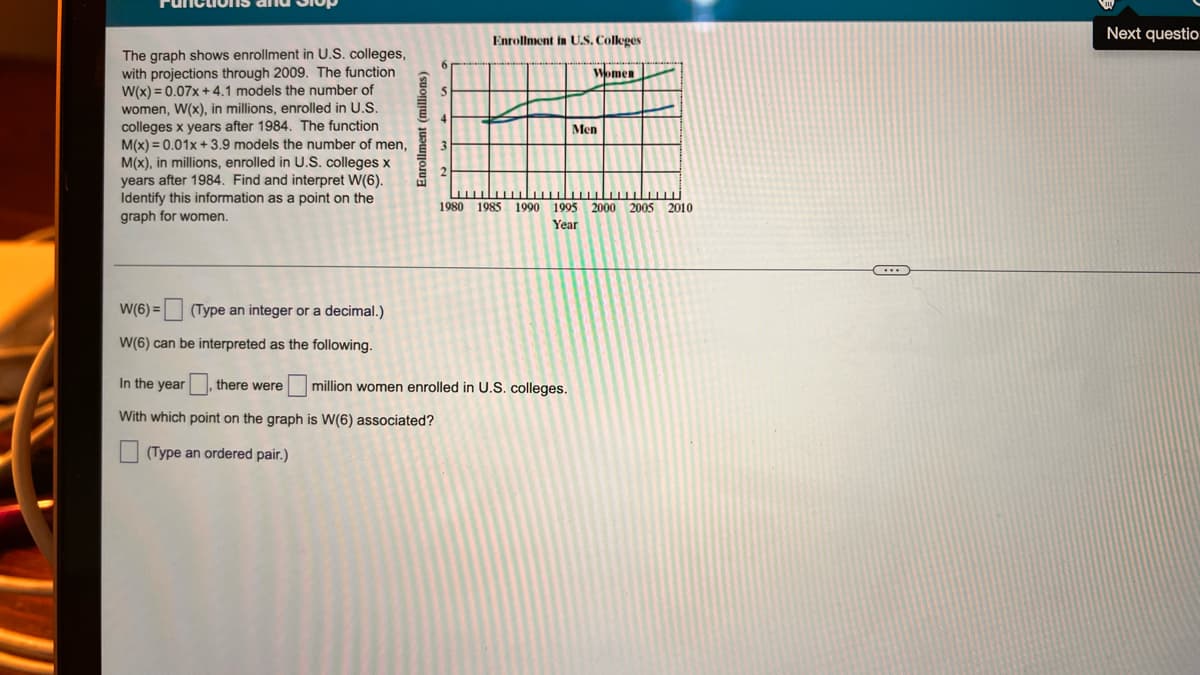
Enrollment in U.S, Colleges
The graph shows enrollment in U.S. colleges,
with projections through 2009. The function
W(x) = 0.07x + 4.1 models the number of
women, W(x), in millions, enrolled in U.S.
colleges x years after 1984. The function
M(x) = 0.01x + 3.9 models the number of men,
M(x), in millions, enrolled in U.S. colleges x
years after 1984. Find and interpret W(6).
Identify this information as a point on the
graph for women.
Women
Men
2.
1980 1985 1990 1995
2000 2005
2010
Year
W(6) = (Type an integer or a decimal.)
W(6) can be interpreted as the following.
In the year
there were
million women enrolled in U.S. colleges.
With which point on the graph is W(6) associated?
(Type an ordered pair.)
(suoniu) juawjojua
Expert Solution
This question has been solved!
Explore an expertly crafted, step-by-step solution for a thorough understanding of key concepts.

This is a popular solution!

Trending now
This is a popular solution!

Step by step
Solved in 2 steps with 2 images

Recommended textbooks for you
Trigonometry (MindTap Course List)
Trigonometry
ISBN:
9781337278461
Author:
Ron Larson
Publisher:
Cengage Learning


Holt Mcdougal Larson Pre-algebra: Student Edition…
Algebra
ISBN:
9780547587776
Author:
HOLT MCDOUGAL
Publisher:
HOLT MCDOUGAL
Trigonometry (MindTap Course List)
Trigonometry
ISBN:
9781337278461
Author:
Ron Larson
Publisher:
Cengage Learning
Holt Mcdougal Larson Pre-algebra: Student Edition…
Algebra
ISBN:
9780547587776
Author:
HOLT MCDOUGAL
Publisher:
HOLT MCDOUGAL

Algebra: Structure And Method, Book 1
Algebra
ISBN:
9780395977224
Author:
Richard G. Brown, Mary P. Dolciani, Robert H. Sorgenfrey, William L. Cole
Publisher:
McDougal Littell

Glencoe Algebra 1, Student Edition, 9780079039897…
Algebra
ISBN:
9780079039897
Author:
Carter
Publisher:
McGraw Hill

Big Ideas Math A Bridge To Success Algebra 1: Stu…
Algebra
ISBN:
9781680331141
Author:
HOUGHTON MIFFLIN HARCOURT
Publisher:
Houghton Mifflin Harcourt