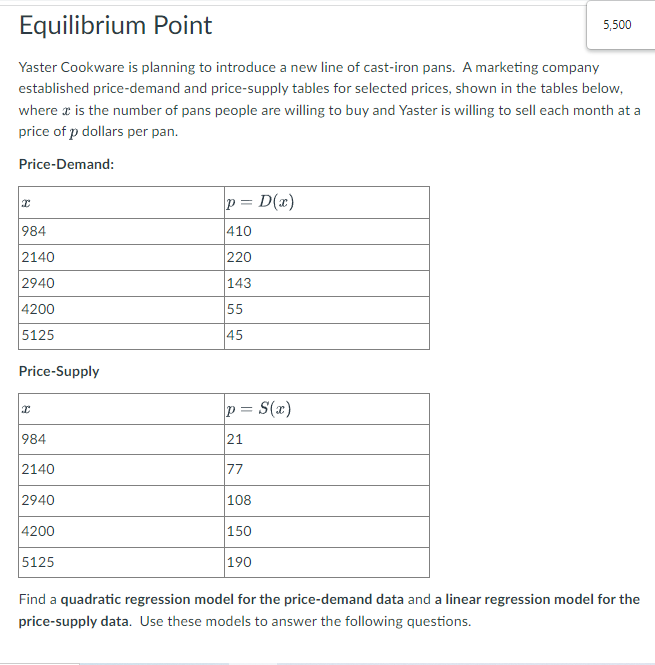
Equilibrium Point 5,500 Yaster Cookware is planning to introduce a new line of cast-iron pans. A marketing company established price-demand and price-supply tables for selected prices, shown in the tables below, where z is the number of pans people are willing to buy and Yaster is willing to sell each month at a price of p dollars per pan. Price-Demand: p = D(x) 984 410 2140 220 2940 143 4200 55 5125 45 Price-Supply p = S(x) 984 21 2140 77 2940 108 4200 150 5125 190 Find a quadratic regression model for the price-demand data and a linear regression model for the price-supply data. Use these models to answer the following questions.
Equilibrium Point 5,500 Yaster Cookware is planning to introduce a new line of cast-iron pans. A marketing company established price-demand and price-supply tables for selected prices, shown in the tables below, where z is the number of pans people are willing to buy and Yaster is willing to sell each month at a price of p dollars per pan. Price-Demand: p = D(x) 984 410 2140 220 2940 143 4200 55 5125 45 Price-Supply p = S(x) 984 21 2140 77 2940 108 4200 150 5125 190 Find a quadratic regression model for the price-demand data and a linear regression model for the price-supply data. Use these models to answer the following questions.

Algebra & Trigonometry with Analytic Geometry
13th Edition
ISBN:9781133382119
Author:Swokowski
Publisher:Swokowski
Chapter9: Systems Of Equations And Inequalities
Section9.4: Linear Programming
Problem 15E

Related questions
Question
Estimate the equilibrium quantity.
pans. ROUND TO THE NEAREST PAN
refer to the graph attached below to answer
thx
apprec
te the help
Transcribed Image Text:Equilibrium Point
5,500
Yaster Cookware is planning to introduce a new line of cast-iron pans. A marketing company
established price-demand and price-supply tables for selected prices, shown in the tables below,
where a is the number of pans people are willing to buy and Yaster is willing to sell each month at a
price of p dollars per pan.
Price-Demand:
p = D(x)
984
410
2140
220
2940
143
4200
55
5125
45
Price-Supply
p = S(x)
984
21
2140
77
2940
108
4200
150
5125
190
Find a quadratic regression model for the price-demand data and a linear regression model for the
price-supply data. Use these models to answer the following questions.
Expert Solution
This question has been solved!
Explore an expertly crafted, step-by-step solution for a thorough understanding of key concepts.

This is a popular solution!

Trending now
This is a popular solution!

Step by step
Solved in 3 steps with 3 images

Recommended textbooks for you
Algebra & Trigonometry with Analytic Geometry
Algebra
ISBN:
9781133382119
Author:
Swokowski
Publisher:
Cengage
Algebra & Trigonometry with Analytic Geometry
Algebra
ISBN:
9781133382119
Author:
Swokowski
Publisher:
Cengage