es the histogram appear too approximate a normal distribution? Why or why not? All changes saved 14 12 10 8. 123.9 124.1 124.3 124.5 124.7 124.9 125.1 125.3 Voltage 5. Yes, there are many values near the center of the distribution, and the frequencies diminish toward either end. No, the values are not evenly distributed. Yes, the bars of the histogram accurately indicate the frequencies of the sample data that were collected in the study. No, there are more values near the center of the histogram than there are at either end. 5 of 10 Frequency 2.
es the histogram appear too approximate a normal distribution? Why or why not? All changes saved 14 12 10 8. 123.9 124.1 124.3 124.5 124.7 124.9 125.1 125.3 Voltage 5. Yes, there are many values near the center of the distribution, and the frequencies diminish toward either end. No, the values are not evenly distributed. Yes, the bars of the histogram accurately indicate the frequencies of the sample data that were collected in the study. No, there are more values near the center of the histogram than there are at either end. 5 of 10 Frequency 2.

Glencoe Algebra 1, Student Edition, 9780079039897, 0079039898, 2018
18th Edition
ISBN:9780079039897
Author:Carter
Publisher:Carter
Chapter10: Statistics
Section10.4: Distributions Of Data
Problem 19PFA

Related questions
Question
Transcribed Image Text:raphing..
Giardina
Cherokee
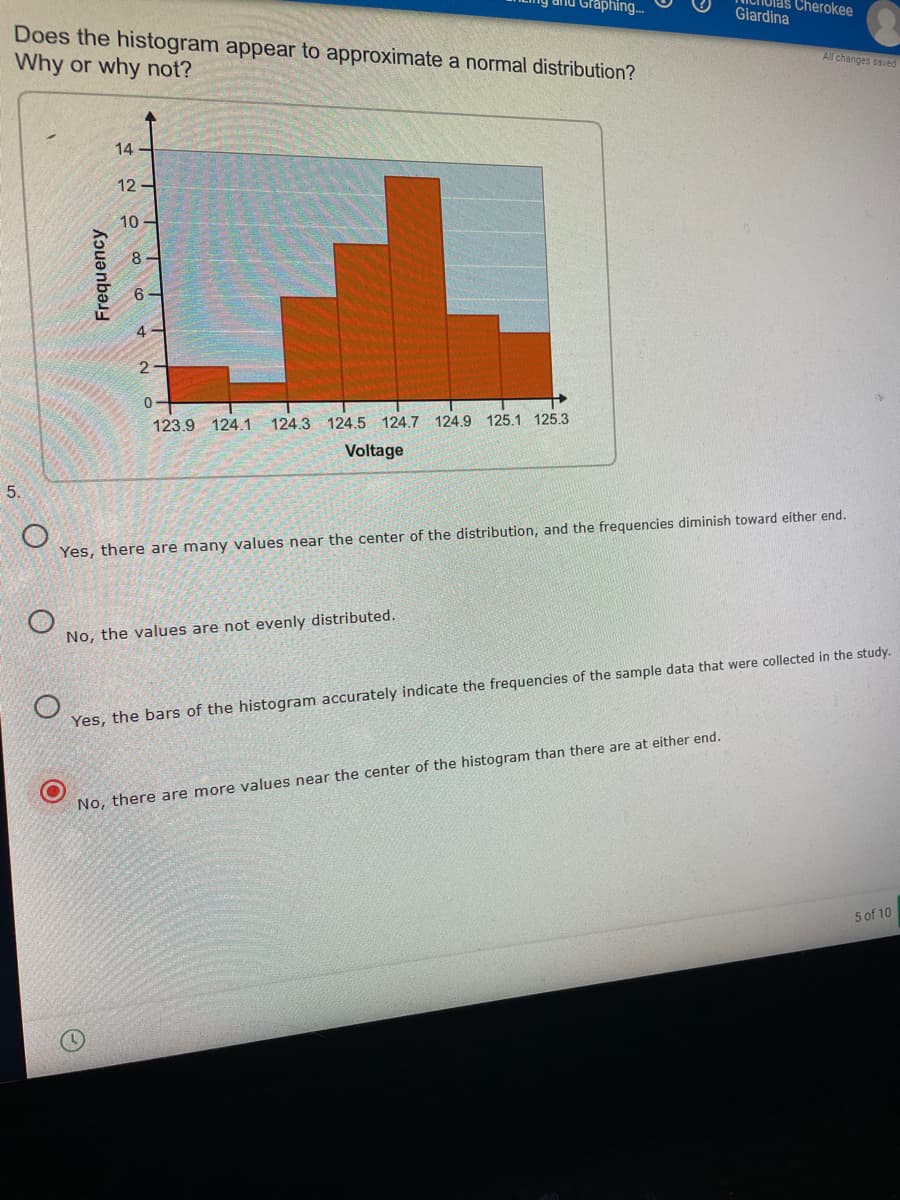
Does the histogram appear to approximate a normal distribution?
Why or why not?
All changes saved
14
12 -
10 -
123.9 124.1
124.3 124.5 124.7
124.9 125.1 125.3
Voltage
5.
Yes, there are many values near the center of the distribution, and the frequencies diminish toward either end.
No, the values are not evenly distributed.
Yes, the bars of the histogram accurately indicate the frequencies of the sample data that were collected in the study.
No, there are more values near the center of the histogram than there are at either end.
5 of 10
Frequency
Expert Solution
This question has been solved!
Explore an expertly crafted, step-by-step solution for a thorough understanding of key concepts.

This is a popular solution!

Trending now
This is a popular solution!

Step by step
Solved in 2 steps

Recommended textbooks for you
Glencoe Algebra 1, Student Edition, 9780079039897…
Algebra
ISBN:
9780079039897
Author:
Carter
Publisher:
McGraw Hill
Glencoe Algebra 1, Student Edition, 9780079039897…
Algebra
ISBN:
9780079039897
Author:
Carter
Publisher:
McGraw Hill