Evaluate the company’s solvency and capital structure using leverage ratios and interpret your findings using the following ratios marks): a. Debt Ratio b. Equity Ratio c. Debt to Equity Ratio d. Long term debt to total capitalization
Q: It indicates the proportion of debt in relation to resources provided by the owners, a. Debt…
A: Lets understand the basics. Debt to equity ratio is a ratio which compares how much proportionate…
Q: Calculate the leverage ratio which includes total debt to total assets ratio, equity multiplier,…
A: Total Debts to Assets ratio = Long term debt + Short term DebtTotal Assets Equity Multiplier = Total…
Q: Calculate the following ratios from balance sheet statement for any organization: • Current ratio •…
A: The current and debt ratio is as follows: The resultant table is as follows:
Q: Please calculate the all ratios of companies - Profitability ratios(Profit margin, Return on assets…
A: Since, we answer only up-to three sub-parts, we shall answer first three. Please resubmit a new…
Q: Which ratio indicates the proportion of assets financed out of shareholders’ funds? (A) Debt equity…
A: Introduction: Any person, organization, or institution that owns stock in a company is a…
Q: The leverage ratio is equal to average total __________divided by average _________________.a.…
A: Leverage ratio: It overlooks the mixture of debt and equity which is required for analyzing the…
Q: Select the Income Statements and Balance Sheets of Aramco Saudi from the calculate the following…
A: solution- Income…
Q: What are the importance of the following financial ratios? Quick ratio. Debt to equity ratio.…
A: 1) Quick ratio= quick assets/ current liabilities Quick assets= current assets- inventory- prepaid…
Q: You have been asked by your CEO to evaluate, analyse and calculate commonly used ratios relating to…
A: Accounting Ratios are the financial tools used by the stakeholders of a company to evaluate the…
Q: Debt-equity ratio is a sub-part of Select one: a. Liquidity ratio b. Solvency ratio c. Profitability…
A: EXPLNANTION:- The debt-equity ratio is an indicator of the lenders' and stockholders' or owners'…
Q: leverage ratio is equal to average total …… divided by average…… Select one: a. assets; common…
A: Solution: leverage ratio = Average total debt / Average total common stpckholders' equity therefore,…
Q: The current ratio is O a solvency measure that indicates the margin of safety for bondholders O…
A: Note: Since you have asked multiple question, we will solve the first question for you. If you want…
Q: If I remember correctly, the DuPont equation breaks down our ROE into three component ratios: the…
A: Dupont Equation: Return on equity = Net profit margin * Total asset turnover ratio * Equity…
Q: The relative proportion of debt, equity, and other securities that a firm has outstanding constitute…
A: Capital structure refers to the amount of money invested in a busines. this amount of money can be…
Q: The following information is given with respect to the ratio's of two companies
A: The ratio is an important tool in financial management to make an analysis of the financial…
Q: ___ indicate the ability of the firm to meet its short-term financial obligations. a.…
A: Ratio measurement is in terms of Financial world, depicts that a sole accounting data by itself may…
Q: The cost of equity is ________. a.equal to the amount of asset turnover b.the interest associated…
A: Cost of an equity is referred to as the return on the firm, which used to make the payment to their…
Q: If your goal is to determine how effective a firm in managing its assets, you would examine O Profit…
A: If the goal is to determine firms effectiveness in managing assets, asset management ratios should…
Q: The cost of equity is ________. Group of answer choices A. the interest associated with debt B. the…
A: Cost of equity: Cost of equity is the percentage amount of dividend and growth to the paid to the…
Q: What do the liquidity ratios tell you In the financlal analysis? 1 The capital structure of a…
A: SOLUTION- LIQUIDITY RATIO- IT ANALYSE THE VARIOUS CURRENT ASSETS AND CURRENT LIABILITIES OF THE…
Q: The Debt to Equity ratio calculation measures Group of answer choices c. How much debt the company…
A: Debt-to-Equity Ratio refers to the relative proportion of debt and equity to finance the assets of…
Q: Write the formula for the following ratios and what each ratio measures:
A: Ratios are the measure which are used by the company to measure actually as well as it shows the…
Q: Debt to Total Assets Ratio can be improved by: A. Borrowing More, B. Issue of Debentures, C. Issue…
A: Debt to total assets ratio measures the proportion of total assets finance by creditors. it can be…
Q: Railmond Statisties Conadian Notional Railway 2016 Data in million c $) 201지 Net income 5,484 73,640…
A: Honor code: Since we only answer up to 3 sub-parts, we’ll answer the first 3. Please resubmit the…
Q: The proportions of debt and equity used to determine the weighted average cost of capital for the…
A: The answer for the True or false question and relevant explanation are presented hereunder :…
Q: As data is attached to the image. You are required to comment/analyze on Feroze 1888 Mills Ltd…
A: Leverage: The leverage of a company indicates how much of the asset is financed through debt. Debt…
Q: he current ratio is a. calculated by dividing current liabilities by current assets. b. used to…
A: Current ratio is a liquidity ratio calculated by dividing current assets by current liabilities.…
Q: How is leverage expressed in DuPont Ratio System? a) Total Debt / Equity b) Total Debt / Total…
A: Dupont ratio system is used to analysis the financial statements and assess its financial condition.…
Q: Which one of the following is the best indicator of long-term debt paying ability? A)Working…
A: Working capital turnover Working capital turnover is a ratio that measures how efficiently a company…
Q: Requirement 1. Compute the FINANCIAL ratios that measure a. Liquidity • Current ratio • Quick ratio…
A: As per our guidelines, we are supposed to answer only 3 sub parts. For balance answer, please…
Q: A profitability measure of ROE is affected by the level of a firm’s debt. Thus, an investor must…
A: The effect of financial leverage is the difference between ROE and ROA because ROE is a measure that…
Q: Which of the following is a Profitability Ratio a. Proprietary Ratio b. Debt-Equity Ratio c.…
A: The profitability ratio determines the ability of an entity to generate profits as a result of…
Q: Which one of the following ratios is relevant to assess long-term solvency? A. Current Ratio B.…
A: Since you have asked multiple question, we will solve the first question for you relating to long…
Q: According to DuPont analysis, the impact of debt on a company's profitability is measured by the.…
A: Dupont analysis is a framework to analyze Fundamental performance of a corporation.
Q: Help calculating the following ratios: return on equity current ratio quick ratio debt-to-equity…
A: ROE = Earning available to Equity shareholders * 100/ Equity shareholders fund Current Ratio =…
Q: Under this concept, the entity would first use a fixed ratio of retained earnings and long-term debt…
A: Company have many method and Theory to arrange its finance. Following is the correct answer.
Q: In the Du Pont method of analysis the two key drivers of return on equity are: a) Profit margin and…
A: Since you have asked multiple questions, we will solve the first question for you. If you want any…
Q: Which of the following is an advantage of EV/EBITDA ratio compared with P/E ratio? A. EV/EBITDA…
A: Financial ratios are the measures that are used in the financial analysis of a corporation, and are…
Q: Long-term solvency is indicated by a. Current ratio b. Debt/equity ratio c. Operating ratio d. Net…
A: Solvency refers to the company's ability to repay it's debt
Q: Which one of the following financial ratios measures a firm’s leverage: a. quick ratio b. current…
A: Leverage ratios are tools used in the financial analysis of a company. Leverage ratios measure how…
Q: 1- Calulate the following liquidity ratio: a. Current Ratio b. Quick Ratio 2-Calulate the…
A: “Since you have posted a question with multiple sub-parts, we will solve the first three sub-parts…
Q: atios are used to analyze activities in the following areas: a. asset management; liquidity;…
A: The question is based on the concept of Ratio Analysis.
Q: Based on financial reports prepare ratio analysis and interpret the result of the Following ratios:…
A: Ratio Analysis is the financial analysis technique which evaluate the profitability, liquidity,…
Q: Financial ratio analysis is conducted by managers, equity investors, longterm creditors, and…
A: Financial ratio are numberical values taken from financial statement to eqvalute financial health of…
Q: The following information is given with respect to the ratio of two companies…
A: Ratio analysis is a method to analyze the liquidity, profitability, long term solvency and overall…
Evaluate the company’s solvency and capital structure using leverage ratios and interpret your findings using the following ratios
marks):
a. Debt Ratio
b. Equity Ratio
c. Debt to Equity Ratio
d. Long term debt to total capitalization
e. Times Interest Earned Ratio
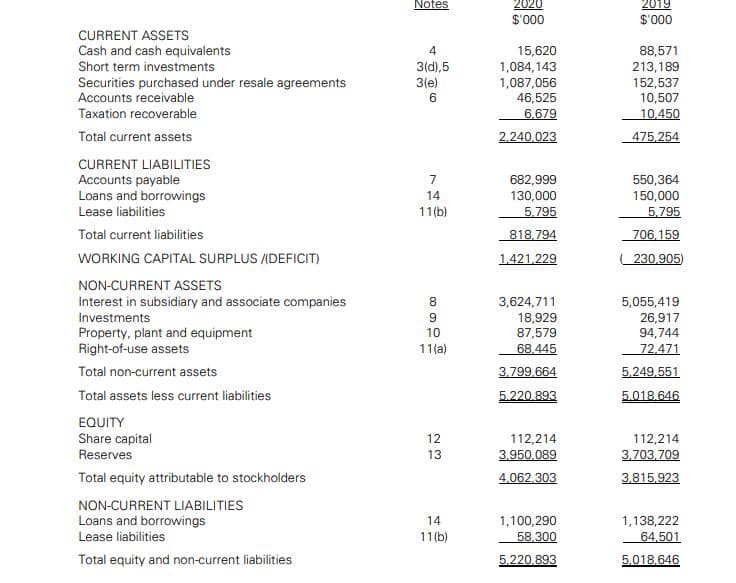
Trending now
This is a popular solution!
Step by step
Solved in 2 steps with 1 images
- 2020 R0'000 2019 R0'000 ASSETS Non-current assets Property, plant and equipment 238,924 246,322 Right-of-use assets 3,246 3,479 Capital spares 566 487 242,736 250,288 Current assets Inventory 1,913 1.911 Trade and other receivables 15,249 5,118 Short term deposit 1,154 1,578 Cash and cash equivalents 1,543 1,883 19,859 10,490 TOTAL ASSETS 262,595 260,778 List all the fixed assets and categorize them in Tangible and Intangible Assets Using Notes to Accounts.ShafNita Sdn. Bhd. Statement of Financial Position as at 31 December2019 2020RM RM RM RM Non Current AssetsBuilding 100,000 100,000Fixtures less accumulated depreciation 3,600 4,000Van less accumulated depreciation 7,840 14,800111,440 118,800 Current AssetInventory 11,200 24,800Trade account receivable 12,800 16,400Bank 1,800 -Cash 440 400 26,240 41,600Total assets 137,680 160,400Finance by:Capital account:Balance at 1 January 74,080 105,080Add: Net profit for the year 70,400 42,320Cash introduced - 20,000144,480 167,400Less: Drawings (39,400) (43,200)105,080 124,200 Non Current LiabilitiesLoan (repayable in 10 years time) 20,000 30,000Current LiablitiesAccount Payable 12,600 6,012Bank overdraft - 188Retained earnings 32,600 36,200Total liabilities and equity 137,680 160,400 Additional information at 31 December 2020: Fixtures bought in 2020 cost RM800. Van bought in 2020 cost RM11,000. Required: Prepare statement of cash flow for ShafNita Sdn. Bhd. for the year ended 31 December…Use the below information to answer the following questions: 20202021Sales$11,573$12,936Depreciation 1661 1736Cost of goods sold 3979 4707Other Expenses 846 924Interest Expense 776 926Cash 6067 6466Accounts Receivables 8034 9427Short-term Notes Payable 1171 1147Long-term debt 20,320 24,696Net fixed assets 50,888 54,273Accounts Payable 4384 4644Tax rate 26% 34%Inventory 14,283 15,288Payout ratio 33% 30% A. Create the Balance Sheets for 2020 & 2021.
- Use the below information to answer the following questions: 20202021Sales$11,573$12,936Depreciation 1661 1736Cost of goods sold 3979 4707Other Expenses 846 924Interest Expense 776 926Cash 6067 6466Accounts Receivables 8034 9427Short-term Notes Payable 1171 1147Long-term debt 20,320 24,696Net fixed assets 50,888 54,273Accounts Payable 4384 4644Tax rate 26% 34%Inventory 14,283 15,288Payout ratio 33% 30% A. Create the Income Statements for 2020 and 2021 (including dividends paid and retained earnings).D CONSOLIDATED STATEMENTS OF FINANCIAL POSITION December 31, December 31, PERCENTAGE 2021 2020 USD USD Assets Current assets Cash and cash equivalents 34,115,412 25,681,845 Short-term financial instruments 71,417,748 80,798,680 Short-term financial assets at amortized cost 2,944,705 2,409,853 Short-term financial assets at fair value through profit or loss 35,624 62,452 Trade receivables 35,585,565 27,065,012 Non-trade receivables 3,930,828 3,150,548 Prepaid expenses 2,042,001 1,980,685 Inventories 36,172,043 28,007,314 Other current assets 4,441,629 3,281,589 Assets held-for-sale - 812,370 Total Current Assets 190,685,555 173,250,348 Non-current assets Financial assets at fair value through other comprehensive income 12,206,843 10,991,369 Financial assets at fair value through profit or loss 1,333,227 1,051,455 Investment in associates and joint ventures…P10.5 (LO 2, 3, 5), AP At December 31, 2022, Grand Company reported the following as plant assets. Land $4,000,000Buildings $28,500,000 Less: Accumulated depreciation—buildings 12,100,000 16,400,000Equipment 48,000,000 Less: Accumulated depreciation—equipment 5,000,000 43,000,000Total plant assets $63,400,000During 2023, the following selected cash transactions occurred. April 1 Purchased land for $2,130,000.May 1 Sold equipment that cost $750,000 when purchased on January 1, 2019. The equipment was sold for $450,000.June 1 Sold land purchased on June 1, 2013 for $1,500,000. The land cost $400,000.July 1 Purchased equipment for $2,500,000.Dec. 31 Retired equipment that cost $500,000 when purchased on December 31, 2013.
- E10.18 (LO 5), AN Suppose the following financial data were reported by 3M Company for 2021 and 2022 (dollars in millions). 3M CompanyBalance Sheets (partial) 2022 2021 Current assets Cash and cash equivalents $ 3,040 $1,849 Accounts receivable, net 3,250 3,195 Inventories 2,639 3,013 Other current assets 1,866 1,541 Total current assets $10,795 $9,598 Current liabilities $ 4,897 $5,839 Instructions Calculate the current ratio and working capital for 3M for 2021 and 2022. Suppose that at the end of 2022, 3M management used $300 million cash to pay off $300 million of accounts payable. How would its current ratio and working capital have changed?Question EXHIBIT 1: ANNUAL RETURNS (%) YEAR ALUWORKS AGA Lyxor USDJIA Lyxor World 2009 2.00 5.86 5.56 7.69 2010 4.25 22.40 6.11 5.79 2011 -29.40 -27.07 7.94 -3.28 2012 13.23 0.60 18.29 20.75 2013 8.86 -6.84 17.09 14.14 2014 2.31 33.87 14.20 15.06 2015 -2.96 -9.28 -4.71 -4.28 EXHIBIT 2: PORTFOLIO WEIGHTS (%) ASSETS EXISTING PORTFOLIO NEW PORTFOLIO ALUWORKS 60 40 AGA 40 30 LYXOR 30 Required1.Using the annual return data provided in Exhibit 1 of the case for ALUWORKS and AGA,calculate their mean returns, standard deviations, covariance, and correlation. With these numbers,calculate the standard deviation and return for Desiree Mofakye’s entire portfolio. 2. After adding Lyxor USDJIA, what is the portfolio’s new standard deviation and return? Howdoes the new portfolio compare with the calculation in Question 1? 3. Based on your data analysis, should Desiree Mofakye diversify her portfolio or remain invested in SA and GHANA only? 4. Calculate the…1. How much is the net share in the profit or loss of the associate (investment income) in 2021? P480,000 P825,000 P420,000 P135,000 2. How much is the carrying amount of the investment as of December 31, 2021? P7,815,000 P8,025,000 P7,680,000 P7,125,000
- 24 If K.mart.CO total assets is 600000, and total liabilities 400000, and goodwill 20000. Compute the identifiable net assets. Select one: a. 180000. b. 200000. c. 220000. d. 240000.SME Balance Sheet 2021 2020 Assets (in millions) Cash 85.960 56.460 Receivables 89.560 80.670 Inventories 55.750 41.260 Other Current Assets 9.950 6.760 Total Current Assets 241.220 185.150 Net Property, Plant, and Equipment 78.970 68.930 Goodwill and Other Intangible Assets 103.110 104.360 Other Non-Current Assets 6.900 4.200 Total Assets 430.200 362.640 Total Liabilities and Shareholders' Equity Payables 83.240 57.48 Current Debt 2.700 2.64 Total Current Liabilities 85.940 60.120 Long-Term Debt 122.000 119.62 Other Liabilities 21.880 22.58 Total Liabilities 229.820 202.320 Common Stock 200.380 160.32 Total Equity 200.38 160.32 Total Liabilities and Equity 430.200 362.640 INCOME STATEMENT 2021 Total Revenue (M) 488.10…SME Balance Sheet 2021 2020 Assets (in millions) Cash 85.960 56.460 Receivables 89.560 80.670 Inventories 55.750 41.260 Other Current Assets 9.950 6.760 Total Current Assets 241.220 185.150 Net Property, Plant, and Equipment 78.970 68.930 Goodwill and Other Intangible Assets 103.110 104.360 Other Non-Current Assets 6.900 4.200 Total Assets 430.200 362.640 Total Liabilities and Shareholders' Equity Payables 83.240 57.48 Current Debt 2.700 2.64 Total Current Liabilities 85.940 60.120 Long-Term Debt 122.000 119.62 Other Liabilities 21.880 22.58 Total Liabilities 229.820 202.320 Common Stock 200.380 160.32 Total Equity 200.38 160.32 Total Liabilities and Equity 430.200 362.640 INCOME STATEMENT 2021 Total Revenue (M) 488.10…