EXERCISE 1 R PROGRAMMING Use the dataset below for this assignment. 1. diamonds Dataset (A dataset containing the prices and other attributes of almost 54,000 diamonds.) Use the given dataset (diamonds) to create the basic and interactive dashboard as shown in the image attached. Figure 1.0 is merely an example; you may apply and customize the interface outlook, as well as modify the code, as long as it fits the best criteria to show the diamonds dataset analysis. a. In your dashboard, you should display the following information: 1. Display the dataset header and print the first 5 rows. 2. Display a brief explanation of the diamonds dataset. Sample dataset: mobility_data.csv -> https://www.google.com/covid19/mobility/


EXERCISE 1
R
Use the dataset below for this assignment.
1. diamonds Dataset (A dataset containing the prices and other attributes of almost 54,000
diamonds.)
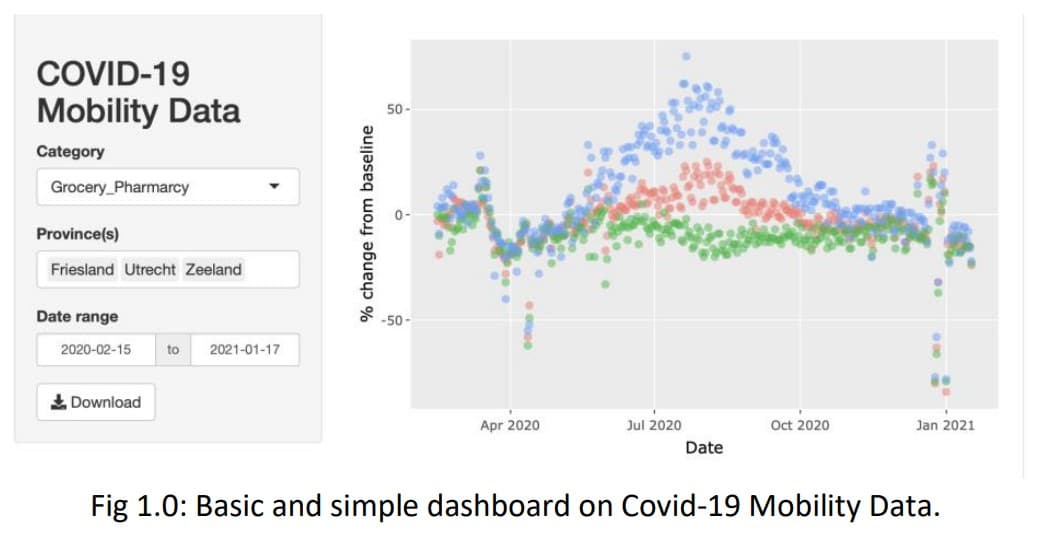
Use the given dataset (diamonds) to create the basic and interactive dashboard as shown in the image attached. Figure 1.0 is merely an example; you may apply and customize the interface outlook, as well as modify the code, as long as it fits the best criteria to show the diamonds dataset analysis.
a. In your dashboard, you should display the following information:
1. Display the dataset header and print the first 5 rows.
2. Display a brief explanation of the diamonds dataset.
Sample dataset: mobility_data.csv
-> https://www.google.com/covid19/mobility/


Trending now
This is a popular solution!

Step by step
Solved in 3 steps with 1 images


