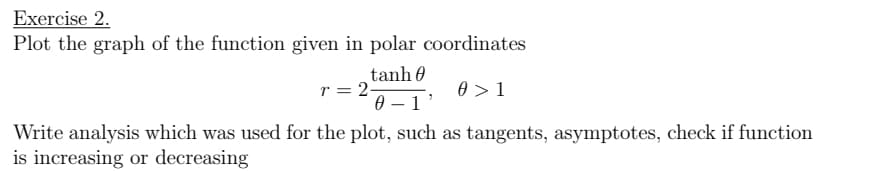
Exercise 2. Plot the graph of the function given in polar coordinates tanh0 0-1¹ 0>1 r = 2- Write analysis which was used for the plot, such as tangents, asymptotes, check if function is increasing or decreasing
Exercise 2. Plot the graph of the function given in polar coordinates tanh0 0-1¹ 0>1 r = 2- Write analysis which was used for the plot, such as tangents, asymptotes, check if function is increasing or decreasing

Algebra & Trigonometry with Analytic Geometry
13th Edition
ISBN:9781133382119
Author:Swokowski
Publisher:Swokowski
Chapter11: Topics From Analytic Geometry
Section11.5: Polar Coordinates
Problem 41E

Related questions
Question
Could you explain with details, please?
Transcribed Image Text:Exercise 2.
Plot the graph of the function given in polar coordinates
tanh 0
r = 2-
0 > 1
0 – 1'
Write analysis which was used for the plot, such as tangents, asymptotes, check if function
is increasing or decreasing
Expert Solution
This question has been solved!
Explore an expertly crafted, step-by-step solution for a thorough understanding of key concepts.

Step by step
Solved in 2 steps with 1 images

Knowledge Booster


Learn more about
Need a deep-dive on the concept behind this application? Look no further. Learn more about this topic, advanced-math and related others by exploring similar questions and additional content below.Recommended textbooks for you
Algebra & Trigonometry with Analytic Geometry
Algebra
ISBN:
9781133382119
Author:
Swokowski
Publisher:
Cengage
Algebra & Trigonometry with Analytic Geometry
Algebra
ISBN:
9781133382119
Author:
Swokowski
Publisher:
Cengage