Exercise 2.3.The following table gives the weight (lbs) and age (years) of 4 persons. Amy Bob Chris 110 50 100 28 18 24 Students Weight (x) Age (y) Don 150 76 (a) Select all possible SRSWOR samples each of n = 3 units. Compute y, X and F. (b) Show the unbiasedness of estimator of the population mean Y defined as YHR=FX+ (N-1) n N (n-1) (y - Fx) 1 n where F = -2, and other symbols have their usual meanings. n1=1 X₁ (c) Find the relative efficiency of HR with respect to the sample mean estimator y. Hint: Use E(R)= Y and V() = P₁ {√) - Y}. HR HR(1)
Exercise 2.3.The following table gives the weight (lbs) and age (years) of 4 persons. Amy Bob Chris 110 50 100 28 18 24 Students Weight (x) Age (y) Don 150 76 (a) Select all possible SRSWOR samples each of n = 3 units. Compute y, X and F. (b) Show the unbiasedness of estimator of the population mean Y defined as YHR=FX+ (N-1) n N (n-1) (y - Fx) 1 n where F = -2, and other symbols have their usual meanings. n1=1 X₁ (c) Find the relative efficiency of HR with respect to the sample mean estimator y. Hint: Use E(R)= Y and V() = P₁ {√) - Y}. HR HR(1)

Chapter4: Linear Functions
Section: Chapter Questions
Problem 30PT: For the following exercises, use Table 4 which shows the percent of unemployed persons 25 years or...

Related questions
Question
100%
2.3
Transcribed Image Text:Method of estimation comes closer?
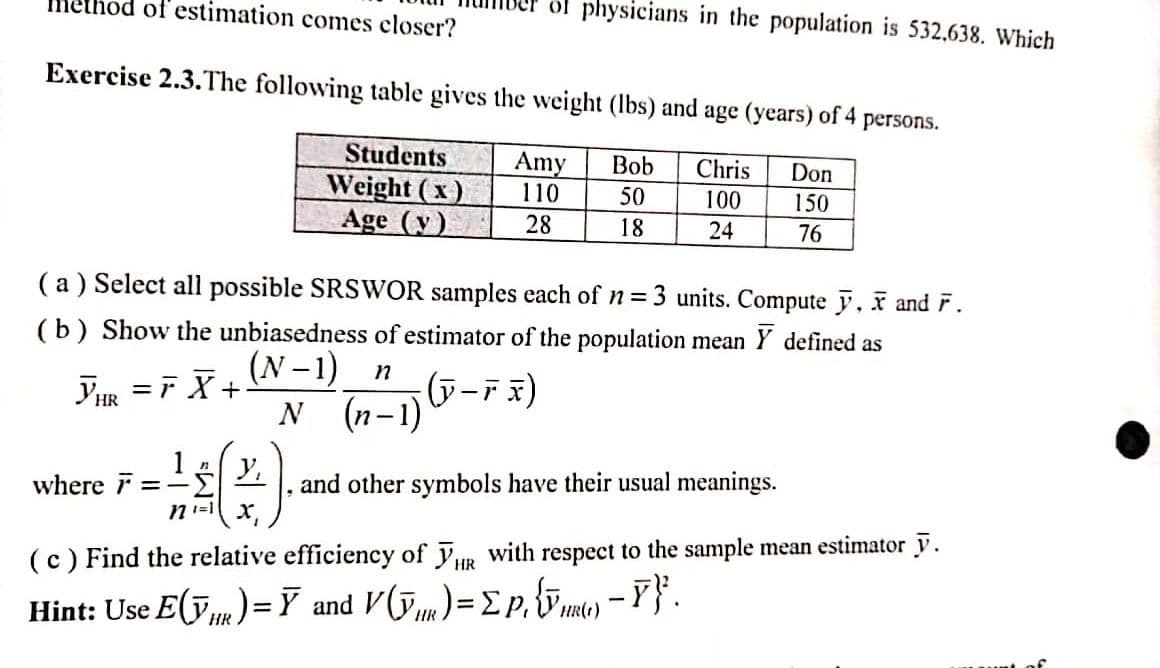
Exercise 2.3. The following table gives the weight (lbs) and age (years) of 4 persons.
Amy Bob Chris
110
50
28
18
where =
Students
Weight (x)
Age (y)
(a) Select all possible SRSWOR samples each of n = 3 units. Compute y, X and F.
(b) Show the unbiasedness of estimator of the population mean Y defined as
(N-1)
YHR=FX+
n
x)
N (n-1) (J-FX)
1 (*).
Σ
of physicians in the population is 532,638. Which
Don
100 150
24
76
and other symbols have their usual meanings.
(c) Find the relative efficiency of HR with respect to the sample mean estimator y.
Hint: Use E(ỹR)= Ỹ and V (Y) = ΣP₁ {√() - Y}².
HR
HR
HR(1)
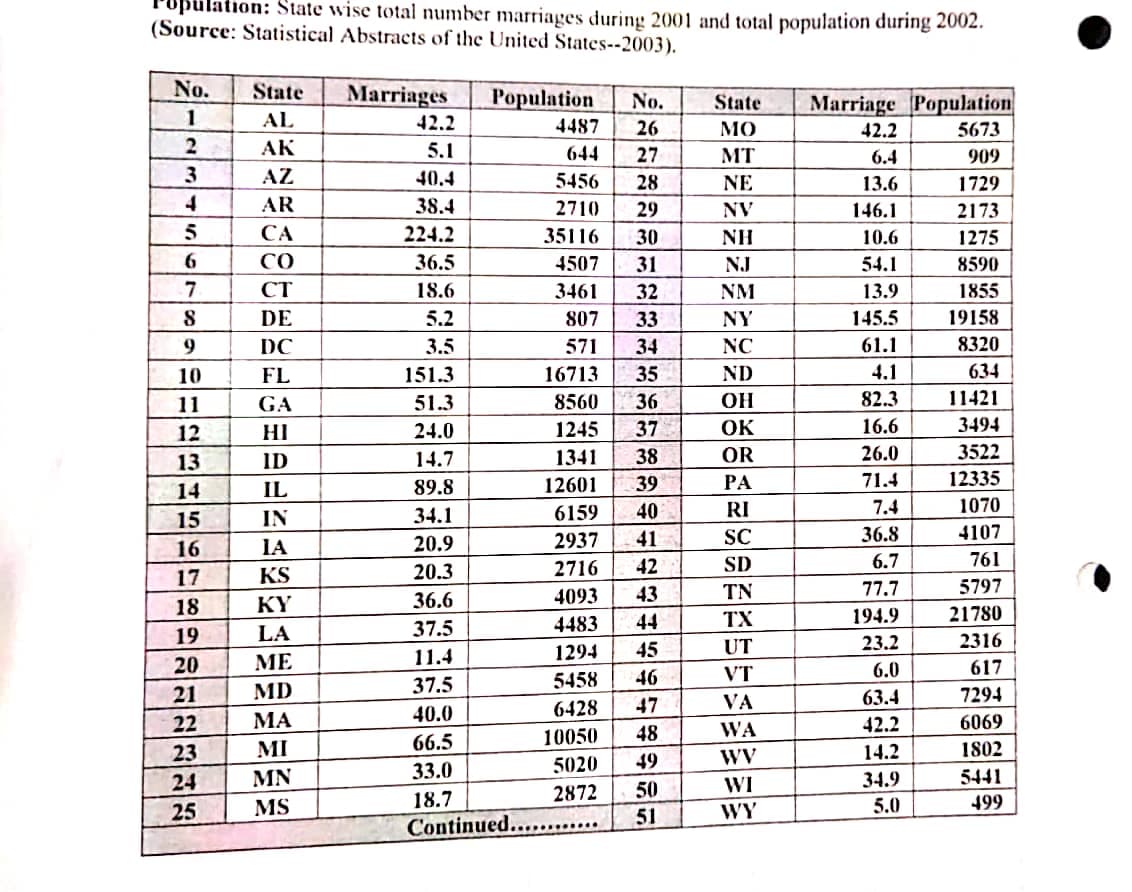
Transcribed Image Text:Upulation: State wise total number marriages during 2001 and total population during 2002.
(Source: Statistical Abstracts of the United States--2003).
No. State Marriages
1
AL
2
AK
3
4
5
6
7
8
9
10
SHAREE
11
12
13
14
15
16
17
18
HERRERIES
19
20
21
22
23
24
25
AZ
AR
CA
CO
CT
DE
DC
FL
GA
НІ
ID
IL
IN
IA
KS
KY
LA
ME
MD
ΜΑ
MI
MN
MS
42.2
5.1
40.4
38.4
224.2
36.5
18.6
5.2
3.5
Population
151.3
51.3
24.0
14.7
89.8
34.1
20.9
20.3
36.6
37.5
11.4
37.5
40.0
66.5
33.0
18.7
Continued...
4487
644
5456
2710
35116
4507
3461
807
571
16713
8560
1245
1341
12601
6159
2937
2716
4093
4483
1294
5458
6428
10050
5020
2872
6 26 27 38 29 301 32 33 34 35 363738 39 40 41 2 3 44 45 46 48 49 50 51
No.
28
42
43
47
State Marriage Population
MO
MT
NE
NV
NH
NJ
NM
NY
NC
ND
OH
OK
OR
PA
RI
SC
SD
TN
TX
UT
VT
VA
WA
WV
WI
WY
42.2
6.4
13.6
146.1
10.6
54.1
13.9
145.5
61.1
4.1
82.3
16.6
26.0
71.4
7.4
36.8
6.7
77.7
194.9
23.2
6.0
63.4
42.2
14.2
34.9
5.0
5673
909
1729
2173
1275
8590
1855
19158
8320
634
11421
3494
3522
12335
1070
4107
761
5797
21780
2316
617
7294
6069
1802
5441
499
Expert Solution
This question has been solved!
Explore an expertly crafted, step-by-step solution for a thorough understanding of key concepts.

Step by step
Solved in 4 steps with 10 images

Recommended textbooks for you

Glencoe Algebra 1, Student Edition, 9780079039897…
Algebra
ISBN:
9780079039897
Author:
Carter
Publisher:
McGraw Hill
Glencoe Algebra 1, Student Edition, 9780079039897…
Algebra
ISBN:
9780079039897
Author:
Carter
Publisher:
McGraw Hill