Explain the process by which an energy dispersive X-ray spectrum (EDX) spectrum is generated and the origins of the La and Ka lines for Fe in the EDX shown in Figure 3 below. Why do the Fe La lines have a lower energy than the Ka lines? By considering the energy of the X-rays measured, discuss whether EDX can be used to measure whether the iron in an iron oxide is in 2+ or 3+ valence state? Which other spectroscopy technique in the transmission electron microscope (TEM) is more appropriate and why?
Explain the process by which an energy dispersive X-ray spectrum (EDX) spectrum is generated and the origins of the La and Ka lines for Fe in the EDX shown in Figure 3 below. Why do the Fe La lines have a lower energy than the Ka lines? By considering the energy of the X-rays measured, discuss whether EDX can be used to measure whether the iron in an iron oxide is in 2+ or 3+ valence state? Which other spectroscopy technique in the transmission electron microscope (TEM) is more appropriate and why?

Related questions
Question
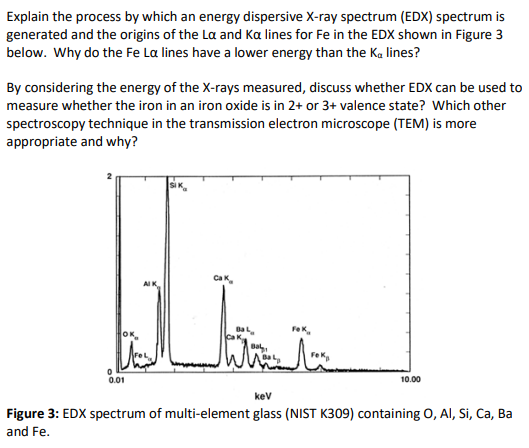
Transcribed Image Text:Explain the process by which an energy dispersive X-ray spectrum (EDX) spectrum is
generated and the origins of the La and Ka lines for Fe in the EDX shown in Figure 3
below. Why do the Fe La lines have a lower energy than the Ka lines?
By considering the energy of the X-rays measured, discuss whether EDX can be used to
measure whether the iron in an iron oxide is in 2+ or 3+ valence state? Which other
spectroscopy technique in the transmission electron microscope (TEM) is more
appropriate and why?
OK
0.01
10.00
kev
Figure 3: EDX spectrum of multi-element glass (NIST K309) containing 0, Al, Si, Ca, Ba
and Fe.
Expert Solution
This question has been solved!
Explore an expertly crafted, step-by-step solution for a thorough understanding of key concepts.

Step by step
Solved in 2 steps
