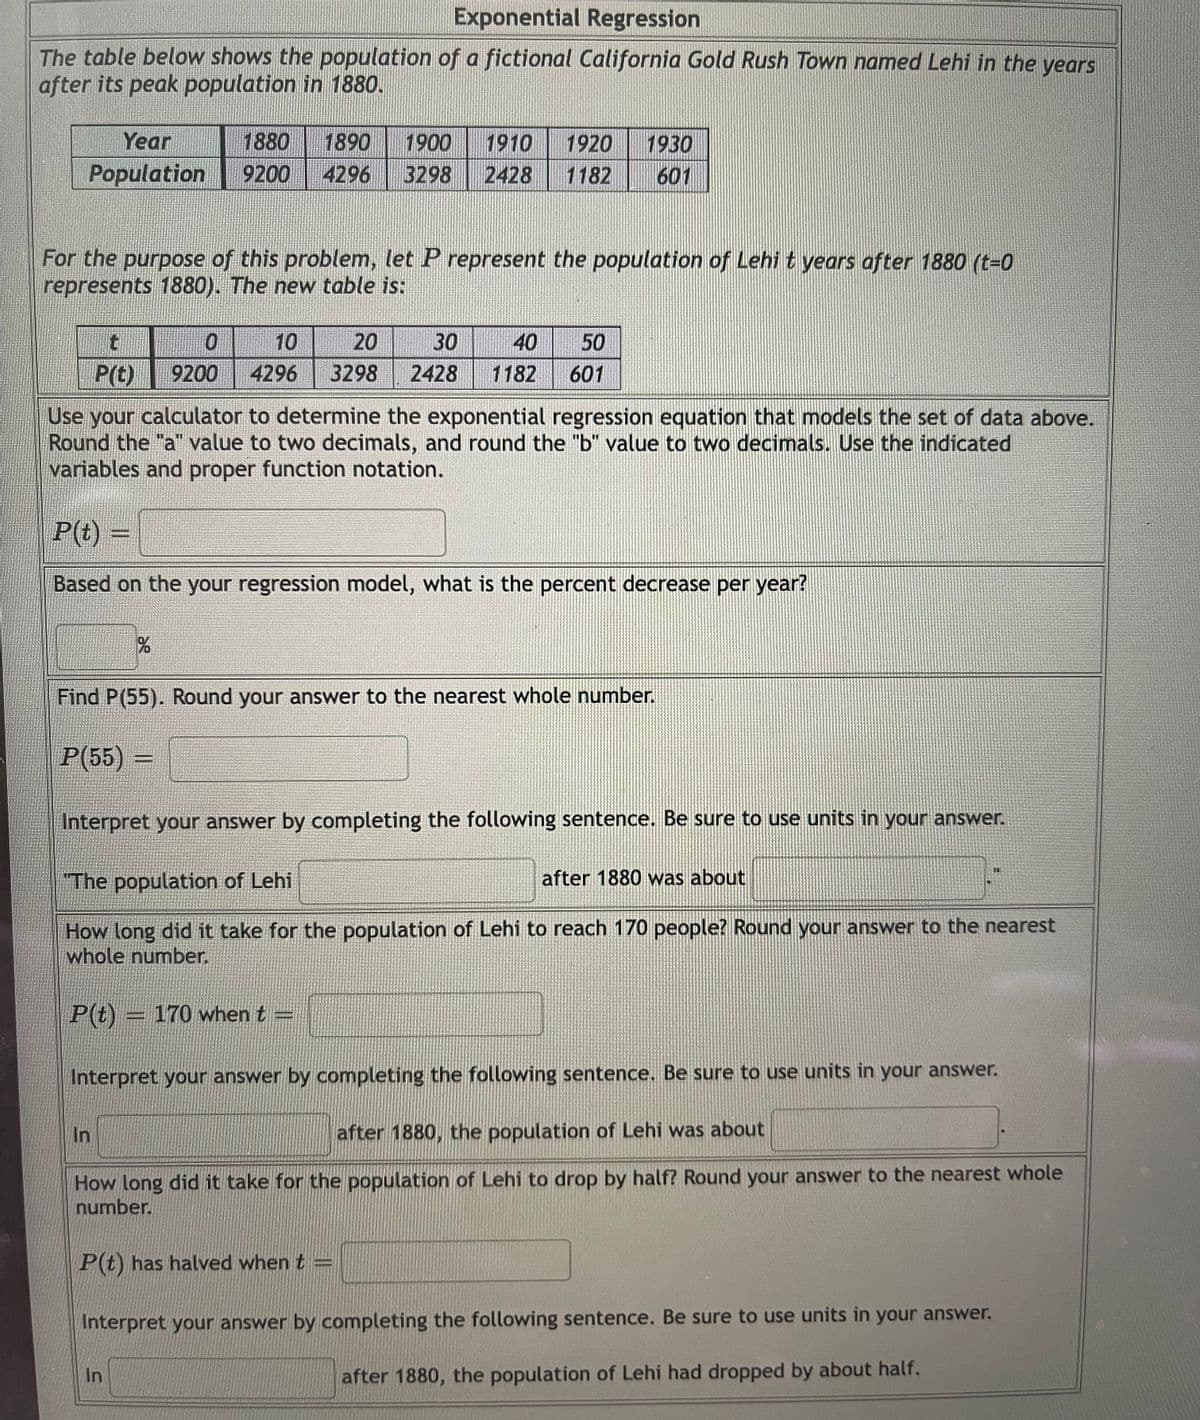
Exponential Regression The table below shows the population of a fictional California Gold Rush Town named Lehi in the years after its peak population in 1880. Year 1880 1890 1900 1910 1920 1930 Population 9200 4296 3298 2428 1182 601 For the purpose of this problem, let P represent the population of Lehi t years after 1880 (t-0 represents 1880). The new table is: 10 20 30 40 50 P(t) 9200 4296 3298 2428 1182 601 Use your calculator to determine the exponential regression equation that models the set of data above. Round the "a" value to two decimals, and round the "b" value to two decimals. Use the indicated variables and proper function notation. P(t) = Based on the your regression model, what is the percent decrease per year? Find P(55). Round your answer to the nearest whole number. P(55) = Interpret your answer by completing the following sentence. Be sure to use units in your answer. "The population of Lehi after 1880 was How long did it take for the population of Lehi to reach 170 people? Round your answer to the nearest whole number. P(t) = 170 when t = Interpret your answer by completing the following sentence. Be sure to use units in your answer. In after 1880, the population of Lehi was about How long did it take for the population of Lehi to drop by half? Round your answer to the nearest whole number. P(t) has halved when t = Interpret your answer by completing the following sentence. Be sure to use units in your answer. In after 1880, the population of Lehi had dropped by about half.
Exponential Regression The table below shows the population of a fictional California Gold Rush Town named Lehi in the years after its peak population in 1880. Year 1880 1890 1900 1910 1920 1930 Population 9200 4296 3298 2428 1182 601 For the purpose of this problem, let P represent the population of Lehi t years after 1880 (t-0 represents 1880). The new table is: 10 20 30 40 50 P(t) 9200 4296 3298 2428 1182 601 Use your calculator to determine the exponential regression equation that models the set of data above. Round the "a" value to two decimals, and round the "b" value to two decimals. Use the indicated variables and proper function notation. P(t) = Based on the your regression model, what is the percent decrease per year? Find P(55). Round your answer to the nearest whole number. P(55) = Interpret your answer by completing the following sentence. Be sure to use units in your answer. "The population of Lehi after 1880 was How long did it take for the population of Lehi to reach 170 people? Round your answer to the nearest whole number. P(t) = 170 when t = Interpret your answer by completing the following sentence. Be sure to use units in your answer. In after 1880, the population of Lehi was about How long did it take for the population of Lehi to drop by half? Round your answer to the nearest whole number. P(t) has halved when t = Interpret your answer by completing the following sentence. Be sure to use units in your answer. In after 1880, the population of Lehi had dropped by about half.

Trigonometry (MindTap Course List)
10th Edition
ISBN:9781337278461
Author:Ron Larson
Publisher:Ron Larson
Chapter5: Exponential And Logarithmic Functions
Section5.5: Exponential And Logarithmic Models
Problem 30E: Population The table shows the mid-year populations (in millions) of five countries in 2015 and the...

Related questions
Question
Transcribed Image Text:Exponential Regression
The table below shows the population of a fictional California Gold Rush Town named Lehi in the years
after its peak population in 1880.
Уears
1880
9200
Year
1890
1910
2428
1900
1920
1930
Population
4296
3298
1182
601
For the purpose of this problem, let P represent the population of Lehi t years after 1880 (t-0
represents 1880). The new table is:
10
20
30
40
50
P(t)
9200
4296
3298
2428
1182
601
Use your calculator to determine the exponential regression equation that models the set of data above.
Round the "a" value to two decimals, and round the "b" value to two decimals. Use the indicated
variables and proper function notation.
P(t) =
%3D
Based on the your regression model, what is the percent decrease per year?
Find P(55). Round your answer to the nearest whole number.
P(55) =
Interpret your answer by completing the following sentence. Be sure to use units in your answer.
"The population of Lehi
after 1880 was about
How long did it take for the population of Lehi to reach 170 people? Round your answer to the nearest
whole number.
P(t) =
170 when t =
Interpret your answer by completing the following sentence. Be sure to use units in your answer.
In
after 1880, the population of Lehi was about
How long did it take for the population of Lehi to drop by half? Round your answer to the nearest whole
number.
P(t) has halved when t =
Interpret your answer by completing the following sentence. Be sure to use units in your answer.
In
after 1880, the population of Lehi had dropped by about half.
Expert Solution
This question has been solved!
Explore an expertly crafted, step-by-step solution for a thorough understanding of key concepts.

Step by step
Solved in 5 steps

Recommended textbooks for you
Trigonometry (MindTap Course List)
Trigonometry
ISBN:
9781337278461
Author:
Ron Larson
Publisher:
Cengage Learning

Algebra & Trigonometry with Analytic Geometry
Algebra
ISBN:
9781133382119
Author:
Swokowski
Publisher:
Cengage

Functions and Change: A Modeling Approach to Coll…
Algebra
ISBN:
9781337111348
Author:
Bruce Crauder, Benny Evans, Alan Noell
Publisher:
Cengage Learning
Trigonometry (MindTap Course List)
Trigonometry
ISBN:
9781337278461
Author:
Ron Larson
Publisher:
Cengage Learning
Algebra & Trigonometry with Analytic Geometry
Algebra
ISBN:
9781133382119
Author:
Swokowski
Publisher:
Cengage
Functions and Change: A Modeling Approach to Coll…
Algebra
ISBN:
9781337111348
Author:
Bruce Crauder, Benny Evans, Alan Noell
Publisher:
Cengage Learning

Elementary Algebra
Algebra
ISBN:
9780998625713
Author:
Lynn Marecek, MaryAnne Anthony-Smith
Publisher:
OpenStax - Rice University

Algebra and Trigonometry (MindTap Course List)
Algebra
ISBN:
9781305071742
Author:
James Stewart, Lothar Redlin, Saleem Watson
Publisher:
Cengage Learning

College Algebra
Algebra
ISBN:
9781305115545
Author:
James Stewart, Lothar Redlin, Saleem Watson
Publisher:
Cengage Learning