STATEMENTS OF PROFIT OR LOSS FOR THE FINANCIAL YEAR ENDED 31 DECEMBER 2020 Company 2019 RM'000 Group 2019 RM'000 Noto 2020 2020 RM'000 RM'000 Revenue 1,673,153 2,705,685 73,341 186,210 Cost of sales (1,372,844) (2,212,000) Gross profit OUier income 300,309 12,445 (35,612) (85,246) 493,685 20,204 (38,151) (81,906) 73,341 5,532 (2,539) (5,080) 186,210 5,945 Admınistrative expenses (3,059) (7,253) Other expenses Operating profit Finonce costs 191,896 393,832 71,254 181,843 (47,920) (50,625) (3,577) (991) Profit before tax 8 143,976 343,207 67,677 180,852 Income tax expense 9. (122,530) (102,064) (1,313) (1,300) Profit for the financial year 21,446 241,143 66,364 179,552 Profit ottributoble to: Ovnurs of Uhe Company 21,227 239,225 66,364 179,552 Non controlling interests 219 1,918 21,446 241,143 66,364 179,552 Group 2020 2019 Earnings por sharo attributablo to ownars of the Company (san par shoro) Basic 10 1.5 16.8 FIVE YEARS FINANCIAL HIGHLIGHTS 2020 2019 2010 2017 2016 RM'000 RM'000 RM'000 RM'000 RM'000 ASSETS Non-current assets Proporty, plant and equipment Right-of-use assets Invastment proparties Investment secunties 65,743 17,731 62,612 15,703 65,093 63,993 60,354 546 370,454 2,738,317 2,738,332 2,738,347 2,738,362 2,738,377 11,529 3,226,845 3,224,608 3,185,969 3,066,607 3,059,503 569,995 533 540 53 580 398,985 398,730 256,062 249,052 Intangible assets Deferred tax 06sets 5,536 8,691 7,637 11,140 Curront assets 349,096 378,797 465,793 573,355 TOTAL ASSETS 3,575,941 3,603,405 3,755,964 3,532,400 3,632,858 EQUITY AND LIABILITIES Equity attributable to owners of the Company Shore copital Reserves 2,154,357 2,154,357 2,154,357 2,154,357 1,437,749 327,796 238,549 353,112 355,796 1,008,510 Treasury shares (1,163) (30,205) (30,205) (30,205) (30,188) Sharaholdars' fund 2,391,743 2,477,264 2,451,948 2,479,948 2,416,071 40,722 Non-controlling interests 22,862 22,645 40,416 40,093 Total aquity 2,414,605 2,499,909 2,492,670 2,520,364 2,456,164 765,570 395,766 Non-currant llabilities 679,707 714,737 548,557 598,873 774,695 Currant liabilitics 423,789 413,163 401,999 Total llabilities 1,161,336 1,103,496 1,263,294 1,012,036 1,176,694 TOTAL EQUITY AND LIABILITIES 3,575,941 3,603,405 3,755,964 3,532,400 3,632,858 GROUP RESULTS Revenuo 1,673,153 2,705,685 2,704,254 2,649,207 2,659,344 Profit bafore tox 143,976 343,207 313,333 306,626 284,490 Income tox expense (122,530) (102,064) (205,287) (97,319) (91,568) Profit for the finoncial year 21,446 (219) 241,143 108,046 209,307 192,922 Non controlling intorests (1,918) (2,657) (2,837) (3,266) Profit attributoble to owners of tho Company 21,227 239,225 105,389 206,470 189,656 SELECTED RATIOS Bosic cornings per shore (sen) Not assats per share (RM) Dividend par share (sen) Return on oquity (%) 1.5 16.8 7.4 14.5 13.3 1.70 13.0 1.66 1.72 15.0 4.30 1.74 1.74 8.5 0.89 16.0 9.66 11.0 8.33 7.85
STATEMENTS OF PROFIT OR LOSS FOR THE FINANCIAL YEAR ENDED 31 DECEMBER 2020 Company 2019 RM'000 Group 2019 RM'000 Noto 2020 2020 RM'000 RM'000 Revenue 1,673,153 2,705,685 73,341 186,210 Cost of sales (1,372,844) (2,212,000) Gross profit OUier income 300,309 12,445 (35,612) (85,246) 493,685 20,204 (38,151) (81,906) 73,341 5,532 (2,539) (5,080) 186,210 5,945 Admınistrative expenses (3,059) (7,253) Other expenses Operating profit Finonce costs 191,896 393,832 71,254 181,843 (47,920) (50,625) (3,577) (991) Profit before tax 8 143,976 343,207 67,677 180,852 Income tax expense 9. (122,530) (102,064) (1,313) (1,300) Profit for the financial year 21,446 241,143 66,364 179,552 Profit ottributoble to: Ovnurs of Uhe Company 21,227 239,225 66,364 179,552 Non controlling interests 219 1,918 21,446 241,143 66,364 179,552 Group 2020 2019 Earnings por sharo attributablo to ownars of the Company (san par shoro) Basic 10 1.5 16.8 FIVE YEARS FINANCIAL HIGHLIGHTS 2020 2019 2010 2017 2016 RM'000 RM'000 RM'000 RM'000 RM'000 ASSETS Non-current assets Proporty, plant and equipment Right-of-use assets Invastment proparties Investment secunties 65,743 17,731 62,612 15,703 65,093 63,993 60,354 546 370,454 2,738,317 2,738,332 2,738,347 2,738,362 2,738,377 11,529 3,226,845 3,224,608 3,185,969 3,066,607 3,059,503 569,995 533 540 53 580 398,985 398,730 256,062 249,052 Intangible assets Deferred tax 06sets 5,536 8,691 7,637 11,140 Curront assets 349,096 378,797 465,793 573,355 TOTAL ASSETS 3,575,941 3,603,405 3,755,964 3,532,400 3,632,858 EQUITY AND LIABILITIES Equity attributable to owners of the Company Shore copital Reserves 2,154,357 2,154,357 2,154,357 2,154,357 1,437,749 327,796 238,549 353,112 355,796 1,008,510 Treasury shares (1,163) (30,205) (30,205) (30,205) (30,188) Sharaholdars' fund 2,391,743 2,477,264 2,451,948 2,479,948 2,416,071 40,722 Non-controlling interests 22,862 22,645 40,416 40,093 Total aquity 2,414,605 2,499,909 2,492,670 2,520,364 2,456,164 765,570 395,766 Non-currant llabilities 679,707 714,737 548,557 598,873 774,695 Currant liabilitics 423,789 413,163 401,999 Total llabilities 1,161,336 1,103,496 1,263,294 1,012,036 1,176,694 TOTAL EQUITY AND LIABILITIES 3,575,941 3,603,405 3,755,964 3,532,400 3,632,858 GROUP RESULTS Revenuo 1,673,153 2,705,685 2,704,254 2,649,207 2,659,344 Profit bafore tox 143,976 343,207 313,333 306,626 284,490 Income tox expense (122,530) (102,064) (205,287) (97,319) (91,568) Profit for the finoncial year 21,446 (219) 241,143 108,046 209,307 192,922 Non controlling intorests (1,918) (2,657) (2,837) (3,266) Profit attributoble to owners of tho Company 21,227 239,225 105,389 206,470 189,656 SELECTED RATIOS Bosic cornings per shore (sen) Not assats per share (RM) Dividend par share (sen) Return on oquity (%) 1.5 16.8 7.4 14.5 13.3 1.70 13.0 1.66 1.72 15.0 4.30 1.74 1.74 8.5 0.89 16.0 9.66 11.0 8.33 7.85

Survey of Accounting (Accounting I)
8th Edition
ISBN:9781305961883
Author:Carl Warren
Publisher:Carl Warren
Chapter9: Metric-analysis Of Financial Statements
Section: Chapter Questions
Problem 9.17E: Profitability metrics The following selected data were taken from the financial statements of The...

Related questions

Question
calculate the interest expenses for the last 5 years (2016, 207, 2018, 2019 & 2020)
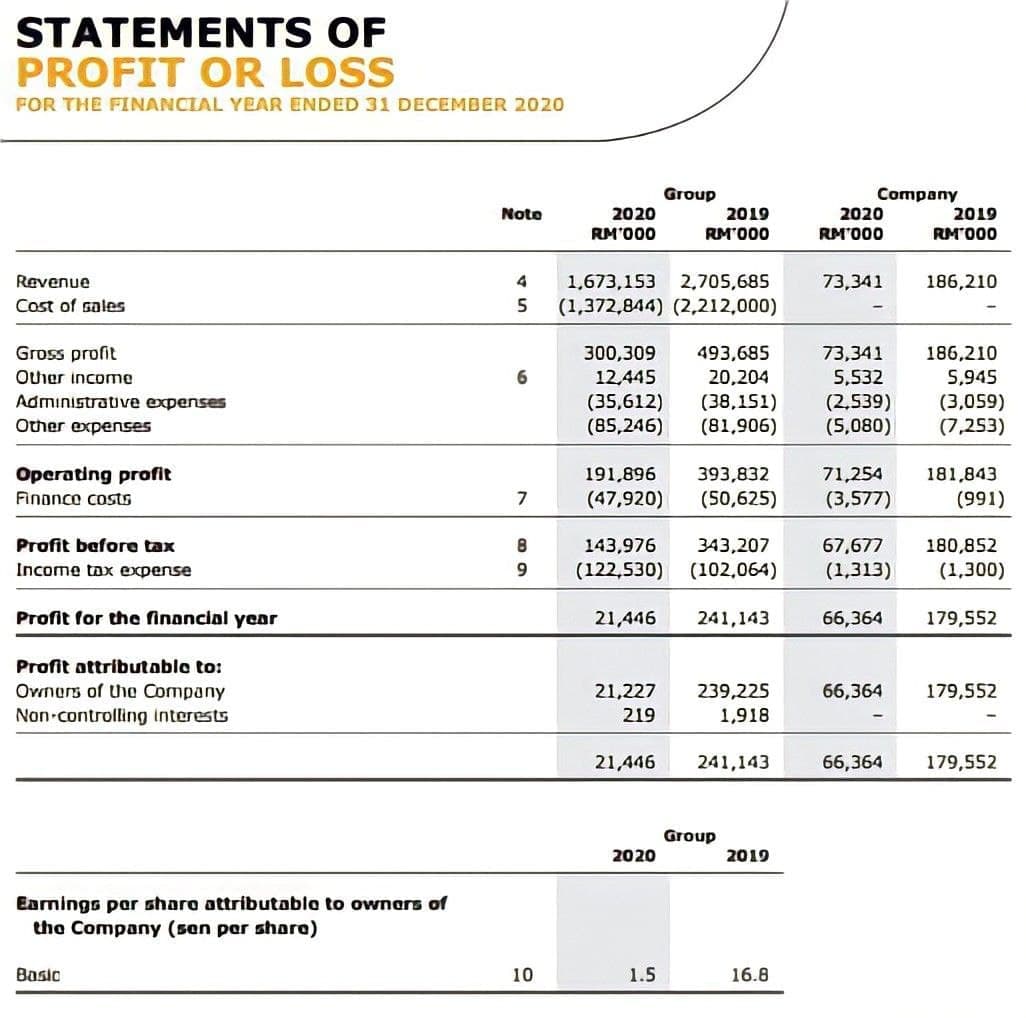
Transcribed Image Text:STATEMENTS OF
PROFIT OR LOSS
FOR THE FINANCIAL YEAR ENDED 31 DECEMBER 2020
Company
2019
RM'000
Group
2019
RM'000
Noto
2020
2020
RM'000
RM'000
Revenue
1,673,153 2,705,685
73,341
186,210
Cost of sales
(1,372,844) (2,212,000)
Gross profit
OUier income
300,309
12,445
(35,612)
(85,246)
493,685
20,204
(38,151)
(81,906)
73,341
5,532
(2,539)
(5,080)
186,210
5,945
Admınistrative expenses
(3,059)
(7,253)
Other expenses
Operating profit
Finonce costs
191,896
393,832
71,254
181,843
(47,920)
(50,625)
(3,577)
(991)
Profit before tax
8
143,976
343,207
67,677
180,852
Income tax expense
9.
(122,530)
(102,064)
(1,313)
(1,300)
Profit for the financial year
21,446
241,143
66,364
179,552
Profit ottributoble to:
Ovnurs of Uhe Company
21,227
239,225
66,364
179,552
Non controlling interests
219
1,918
21,446
241,143
66,364
179,552
Group
2020
2019
Earnings por sharo attributablo to ownars of
the Company (san par shoro)
Basic
10
1.5
16.8
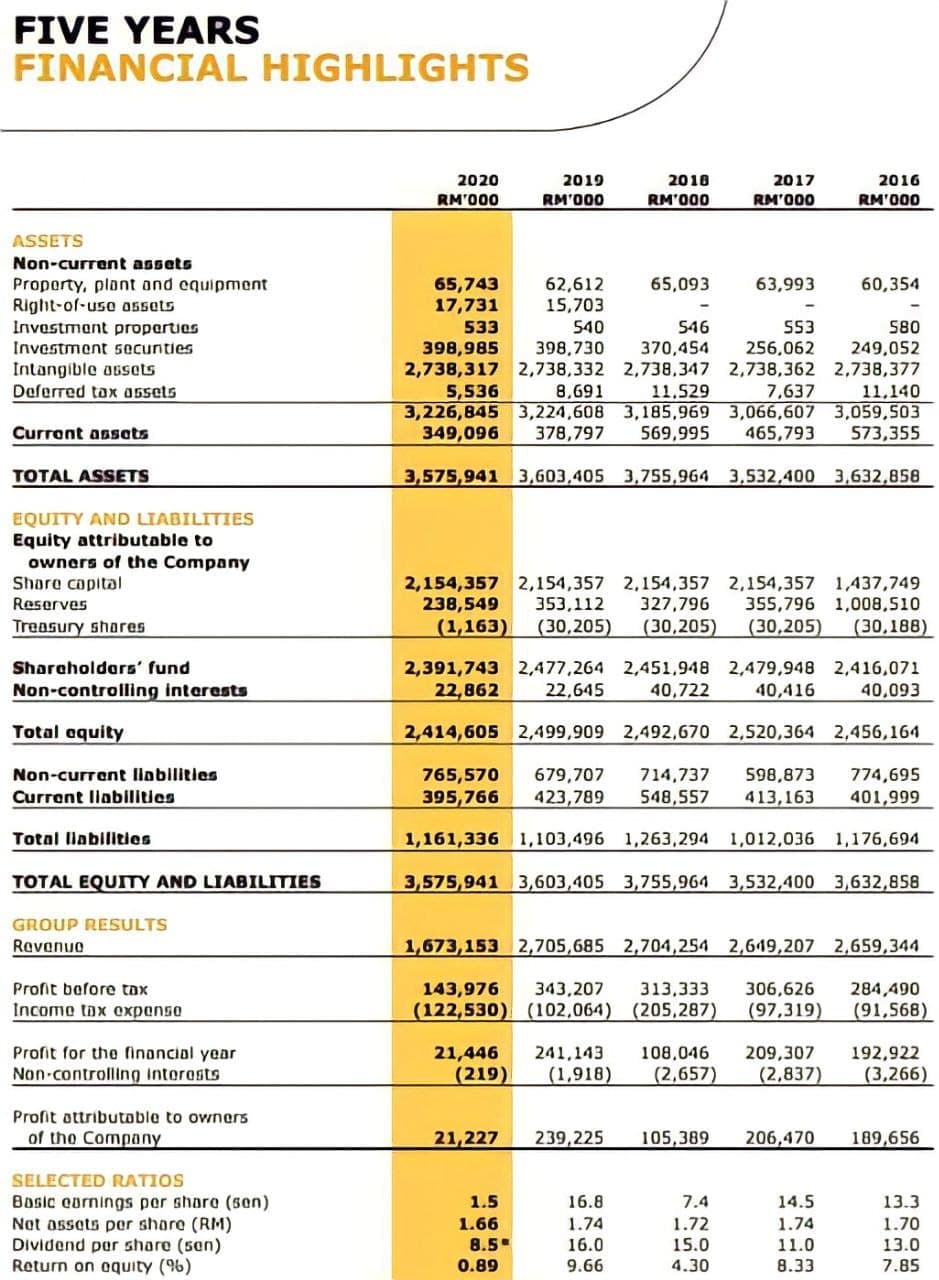
Transcribed Image Text:FIVE YEARS
FINANCIAL HIGHLIGHTS
2020
2019
2010
2017
2016
RM'000
RM'000
RM'000
RM'000
RM'000
ASSETS
Non-current assets
Proporty, plant and equipment
Right-of-use assets
Invastment proparties
Investment secunties
65,743
17,731
62,612
15,703
65,093
63,993
60,354
546
370,454
2,738,317 2,738,332 2,738,347 2,738,362 2,738,377
11,529
3,226,845 3,224,608 3,185,969 3,066,607 3,059,503
569,995
533
540
53
580
398,985
398,730
256,062
249,052
Intangible assets
Deferred tax 06sets
5,536
8,691
7,637
11,140
Curront assets
349,096
378,797
465,793
573,355
TOTAL ASSETS
3,575,941 3,603,405 3,755,964 3,532,400 3,632,858
EQUITY AND LIABILITIES
Equity attributable to
owners of the Company
Shore copital
Reserves
2,154,357 2,154,357 2,154,357 2,154,357 1,437,749
327,796
238,549
353,112
355,796 1,008,510
Treasury shares
(1,163)
(30,205)
(30,205)
(30,205)
(30,188)
Sharaholdars' fund
2,391,743 2,477,264 2,451,948 2,479,948 2,416,071
40,722
Non-controlling interests
22,862
22,645
40,416
40,093
Total aquity
2,414,605 2,499,909 2,492,670 2,520,364 2,456,164
765,570
395,766
Non-currant llabilities
679,707
714,737
548,557
598,873
774,695
Currant liabilitics
423,789
413,163
401,999
Total llabilities
1,161,336 1,103,496 1,263,294 1,012,036 1,176,694
TOTAL EQUITY AND LIABILITIES
3,575,941 3,603,405 3,755,964 3,532,400 3,632,858
GROUP RESULTS
Revenuo
1,673,153 2,705,685 2,704,254 2,649,207 2,659,344
Profit bafore tox
143,976
343,207
313,333
306,626
284,490
Income tox expense
(122,530) (102,064) (205,287)
(97,319)
(91,568)
Profit for the finoncial year
21,446
(219)
241,143
108,046
209,307
192,922
Non controlling intorests
(1,918)
(2,657)
(2,837)
(3,266)
Profit attributoble to owners
of tho Company
21,227
239,225
105,389
206,470
189,656
SELECTED RATIOS
Bosic cornings per shore (sen)
Not assats per share (RM)
Dividend par share (sen)
Return on oquity (%)
1.5
16.8
7.4
14.5
13.3
1.70
13.0
1.66
1.72
15.0
4.30
1.74
1.74
8.5
0.89
16.0
9.66
11.0
8.33
7.85
Expert Solution
This question has been solved!
Explore an expertly crafted, step-by-step solution for a thorough understanding of key concepts.

Step by step
Solved in 2 steps

Knowledge Booster


Learn more about
Need a deep-dive on the concept behind this application? Look no further. Learn more about this topic, accounting and related others by exploring similar questions and additional content below.Recommended textbooks for you
Survey of Accounting (Accounting I)
Accounting
ISBN:
9781305961883
Author:
Carl Warren
Publisher:
Cengage Learning

Cornerstones of Financial Accounting
Accounting
ISBN:
9781337690881
Author:
Jay Rich, Jeff Jones
Publisher:
Cengage Learning

Intermediate Accounting: Reporting And Analysis
Accounting
ISBN:
9781337788281
Author:
James M. Wahlen, Jefferson P. Jones, Donald Pagach
Publisher:
Cengage Learning
Survey of Accounting (Accounting I)
Accounting
ISBN:
9781305961883
Author:
Carl Warren
Publisher:
Cengage Learning
Cornerstones of Financial Accounting
Accounting
ISBN:
9781337690881
Author:
Jay Rich, Jeff Jones
Publisher:
Cengage Learning
Intermediate Accounting: Reporting And Analysis
Accounting
ISBN:
9781337788281
Author:
James M. Wahlen, Jefferson P. Jones, Donald Pagach
Publisher:
Cengage Learning

Fundamentals of Financial Management (MindTap Cou…
Finance
ISBN:
9781337395250
Author:
Eugene F. Brigham, Joel F. Houston
Publisher:
Cengage Learning

Fundamentals Of Financial Management, Concise Edi…
Finance
ISBN:
9781337902571
Author:
Eugene F. Brigham, Joel F. Houston
Publisher:
Cengage Learning