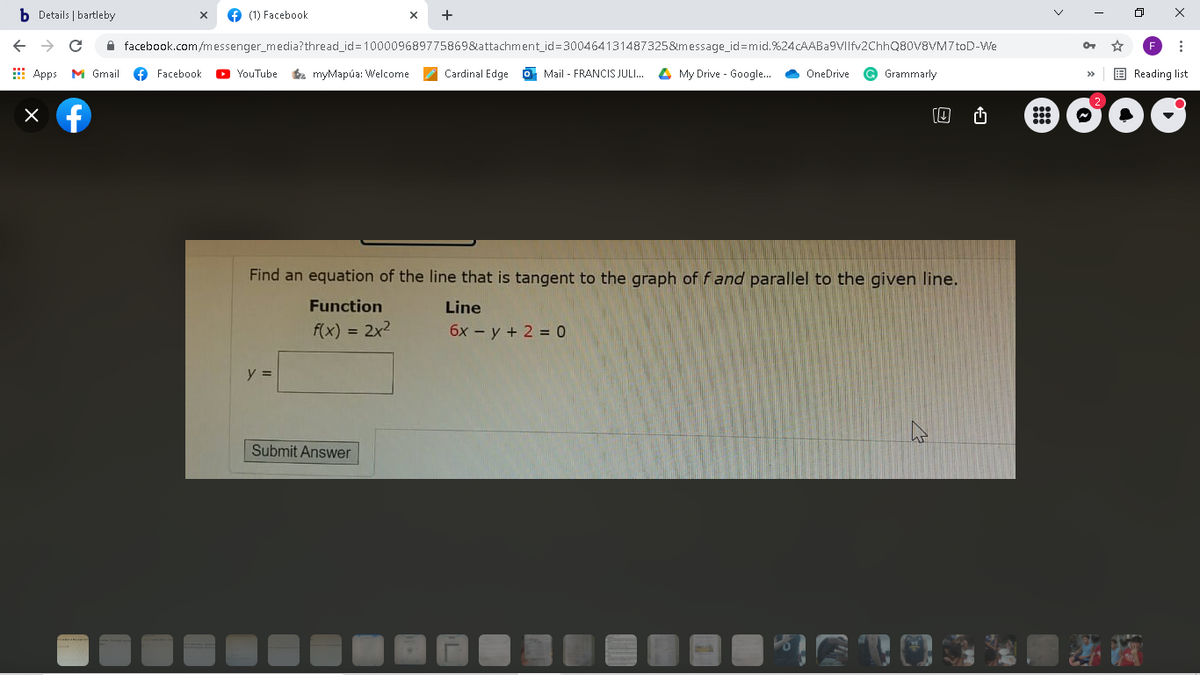
Find an equation of the line that is tangent to the graph of f and parallel to the given line. Function Line f(x) = 2x2 6x - y + 2 = 0 %3D y = Submit Answer


Q: Find the risk of having accident, R. If R is a function of blood alcohol concentration, x, that is…
A:
Q: Find an equation of a line that is tangent to the graph of f and parallel to the given line.…
A:
Q: Find an equation of the line that is tangent to the graph of f and parallel to the given line.
A: Given: fx=x3+2 and3x-y-4=0 To find the equation of the tangent to the graph of f and parallel to the…
Q: The line y= -3x+b is tangent to the function y=x3-3x2. What is the value of b? -2 -1 1 2
A: At the point of tangency the slope of the curve and that of the line should be equal. Slope of the…
Q: Find an equation of a line that is tangent to the graph of f and parallel to the given line.…
A: Let's find.
Q: For the given linear function, make a table of values and sketch its graph. What is the slope of the…
A: Given f(x)=2x-5
Q: Consider the linear function defined by: f(x) = -3x + 2 (a) Calculate: f(-1), f(5) (b) Determine the…
A: Note: As per company guidelines we are supposed to solve only 1 question or 3 subparts. So, kindly…
Q: Find an equation of the line that is tangent to the graph of f and parallel to the given line.…
A:
Q: Find an equation of the level curve of the function h(x, y) = e"(x² + y°) that passes through the…
A:
Q: (c) Find the slope of the curve x²y + xy? = 6 at the point (2, 1).
A:
Q: Find an equation of a line that is tangent to the graph of f and parallel to the given line.…
A: Equation of line : y-y1 = mx-x1 ;where m-slope
Q: A function has a slope of 3, and one solution is given in the table. Identify the missing output 6.…
A: To fill the missing outputs
Q: Which of the plots below shows the graph of the linear function f(x) = -4x – 4
A:
Q: On a recent scuba diving trip, Kate and Kara reached a depth of 130 feet. Six-and-a-half minutes…
A:
Q: Find the slope, x and y intercept/s, vertex(if there are any) of the following function a. f(x) = 7-…
A:
Q: Find an equation for a linear function parallel to the given line passing through the given point. y…
A: Let fx=mx+c be the required linear function. Given that fx=mx+c is parallel to the line y=8x-9 whose…
Q: Which of the following is the equation of a line tangent to the graph of f(x) = x* + 1 and parallel…
A:
Q: Find an equation of the line that is tangent to the graph of f and parallel to the given line.…
A:
Q: Find an equation of a line that is tangent to the graph of f and parallel to the given line.…
A:
Q: Write the linear function in slope-intercept form satisfying the given conditions: Graph of g passes…
A: It is given that the required linear function is perpendicular to thegiven equation x+3y-6=0and…
Q: Find an equation of a line that is tangent to the graph of f and parallel to the given line. Line…
A:
Q: Find an equation for a linear function parallel to the given line passing through the given point. y…
A:
Q: To find the horizontal intercept of a function, what equation do we solve? Oy = 0 O f(x) = 0 y =…
A:
Q: find the linear function with the following properties. f(0)=10 Slope of f = -5/4
A: Here we have to find the linear function with the following properties. f(0)=10 Slope of f = -54
Q: Find the linear function f(x)=mx +b whose graph has given slope and y-intercept. slope is 2/5 and…
A:
Q: Find an equation of a line that is tangent to the graph of f and parallel to the given line.…
A:
Q: Find an equation of a line that is tangent to the graph of f and parallel to the given line.…
A: Here we find equation of a line that is tangent to the graph fx=x3 and parallel to the line…
Q: Find a value of x for which the slope of the curve y = x2 - 6x + 5 is zero. Select one: O a -1 O b.…
A:
Q: snip
A: It is given that, f(x)=-4x+3 ...(1) It is known that, general equation of line is given by,…
Q: Write the equation of the line that is tangent to the function y = xyx and is parallel to y = 2x + 1…
A: Given function, y = x x4 Parallel line to y=2x+1Genral line is y = mx+cOn comparing both the…
Q: How many x-intercepts would the function shown below have? f(x) = ¤(x – 9)(æ² – 2)(x² + 1) - -…
A: Given, fx=xx-9x2-2x2+1
Q: Write the equation of the tangent line to the curve at the indicated point. As a check, graph both…
A:
Q: Find an equation of a line that is tangent to the graph off and parallel to the given line. Function…
A:
Q: Find an equation of a line that is tangent to the graph of fand parallel to the given line. Function…
A:
Q: Solve the equation for y. Determine if y is a function of x. y+ 1 6x? + 5y = 5
A: Given,
Q: Find an equation of a line that is tangent to the graph off and parallel to the given line. Function…
A: The solution of the problem is given in the next steps.
Q: The graph of a linear function f is shown to the right. (a) Identify the slope, y-intercept, and…
A:
Q: For the given linear function, make a table of values and sketch its graph. What is the slope of the…
A: Given : r(t)=-23t+2 Linear equation of the form y=mx+b where m is the slope and b is the y intercept…
Q: Find an equation of a line that is tangent to the graph of f and parallel to the given line. Line…
A: Topic = Derivative
Q: Find an equation of a line that is tangent to the graph of fand parallel to the given line. Function…
A:
Q: Find an equation of a line that is tangent to the graph of f and parallel to the given line.…
A:
Q: Graph the function, f(x) = ½ x– 3. Find the slope, x and y intercepts, if they exist.
A:
Q: If (x) = x³ + + and g(x) = f-'(x), find the slope of the curve g(x) = f ¯'(x)at the point(2, 1). g'…
A:
Q: Find an equation of the line that is tangent to the graph of f and parallel to the given line.…
A:
Q: Find the slope of f(x) = -3x? – 6x at x = 1. %3D %3D
A:
Q: The function y = x³ + ax? + bx + c has a stationary point at (-3,12) and it passes through the point…
A: Since, the function y=x3+ax2+bx+c passes through the point (0,2)⇒2=0+0+0+c⇒c=2-(i)Also, we have been…
Q: For the given linear function, make a table of values and sketch its graph. What is the slope of the…
A: ht=12-34t When t=-4, h-4=12-34-4=12+3=3.5 When t=-2, h-2=12-34-2=12+32=2 When t=0,…
Q: Find the x- and y-intercepts of the graph of the function f (x) = -2 |x – 3| + 2. Enter your answers…
A: We substitute y for f(x) in the given function. therefore, we get y=-2x-3+2 To find the y-intercept,…
Q: Find the linear function, f(x) = mx + b, whose graph has the given slope and y-intercept. Slope 7…
A:
Q: Find an equation of a line that is tangent to the graph of f and parallel to the given line.…
A:

Step by step
Solved in 2 steps with 2 images

- A panel of dentists is interested in testing two different toothpaste brands (A and B) to see if there is a relationship between the brand and whether or not the patient has a cavity at their next appointment. A representative sample of 60 patients is recruited to take part in this study. At their first appointment of the year, each subject is assigned to brush their teeth with one of the two brands for the next six months. At their follow-up appointment six months later, they were checked for cavities. ******In the sample, 6 of the 30 patients assigned to Brand A were found to have a cavity. The fraction 6/30 should be denoted by which of the following? μ x̄ p p̂ n s σ χ²A lecturer at WIN wanted to know if he can predict student’s quiz results by asking them tocomplete a simple survey. The result of the survey is found in the file: Assignment 2 sem22020data set 1. Quiz Results EQR Study Hrs Age Sex BBT MB MC AuHS LM 15 10 3 19 0 0 1 1 0 1 14 15 4 24 0 0 1 0 0 1 9 15 1 20 0 10 1 0 0 1 6 10 3 21 0 0 1 1 0 1 14 15 4 21 0 9 1 0 0 1 12 10 6 21 0 2 0 1 0 1 12 13 2 21 1 8 1 0 0 0 15 15 0 20 0 8 1 0 0 1 12 15 3 20 0 10 1 0 0 1 13 15 0.2 19 0 8 1 0 0 1 15 15 2 20 0 6 1 0 1 1 12 14 5 20 0 5 1 1 1 1 14 15 7 22 0 8 0 0 0 0 7 7 10 21 1 7 0 0 1 0 11 15 5 24 0 0 1 0 0 1 10 10 3 22 1 0 1 0 0 1 13 11 3 23 1 1 1 1 1 1 13 15 2 22 1 8 0 0 0 0 13 12 4 20 1 7 1 0 1 0 13 10 3 20 1 0 1 0 0 1 8 13 5 20 1 8 0 0 0 0 12 13 5 22 0 5 0 0 0 1 13 15 8 22 0 5 0 1 0 1 10 13 4 23 1 7 1 0 0 1 13 13 0.5 20 1 0 0 0 0 0 12 13 0.5 20 1 0 1 0 0 0 15 15 2 21 0 10 1 0 0 1 10 13 6 22 0 6 1 1 0 1 11 8 5 20 0 10 0 0 1 0 12 10 4 19 1…A panel of dentists is interested in testing two different toothpaste brands (A and B) to see if there is a relationship between the brand and whether or not the patient has a cavity at their next appointment. A representative sample of 60 patients is recruited to take part in the study. At their first appointment of the year, each subject is assigned to brush their teeth with one of the two brands for the next six months. At their follow-up appointment six months later, they were checked for cavities. What method of data collection was used? Select one: a.Experiment b.Observational Study
- A panel of dentists is interested in testing two different toothpaste brands (A and B) to see if there is a relationship between the brand and whether or not the patient has a cavity at their next appointment. A representative sample of 60 patients is recruited to take part in the study. At their first appointment of the year, each subject is assigned to brush their teeth with one of the two brands for the next six months. At their follow-up appointment six months later, they were checked for cavities. To test for significance of their findings, which of the following should the dentists use? Select one: a.Paired t-test b.One-sample t-test for a mean c.Linear Regression d.One-sample Z-test for a proportion e.Chi-Square test for independence f.Two-Sample t-test g.One-sample Z-test for a meanFrom time to time, the UTM Human Resource (UTMHR) department observes various employees fortheir work productivity. Recently UTMHR wanted to check whether the four employees at theDepartment XYZ counters, serve on average the same number of customers per hour. The HR managerobserved each of the four employees for a certain number of hours. The following Table 5 gives thenumber of customers served by the four employees during each of the observed hours. employee a employee b employee c employee d 19 14 11 24 21 16 14 19 26 14 21 21 24 13 13 26 18 17 16 20 employee a employee b employee c employee d mean 21.6 14.8 15.0 22.0 s 3.4 ? 3.8 ? c) Find variance between sample,d) Find variance within sample, e) Calculate the test statistic, F.f) Determine the numerator and denominator.g) Find the critical value of F at the 5% significance level, and test the claim that the mean numberof customers served per hour by each of these four employees is…From time to time, the UTM Human Resource (UTMHR) department observes various employees fortheir work productivity. Recently UTMHR wanted to check whether the four employees at theDepartment XYZ counters, serve on average the same number of customers per hour. The HR managerobserved each of the four employees for a certain number of hours. The following Table 5 gives thenumber of customers served by the four employees during each of the observed hours. employee a employee b employee c employee d 19 14 11 24 21 16 14 19 26 14 21 21 24 13 13 26 18 17 16 20 a) Define the hypothesis null, H0 and hypothesis alternative, H1.b) Given below are means and standard deviation for some of the employees. Calculate thestandard deviation for Employee B and D.
- The table below shows 2010 census data on Ubekizakhan with the population of women and the number of births to these women by different age groups;Age of Women Number of Women Number of Children15-19 28568 522020-24 314375 1266825-29 335856 2509030-34 401619 3148935-39 388074 1343840-44 346058 227145-49 301362 78 Assuming the country’s sex ratio at birth was 82 males per 79 females, compute the following; i) General fertility rate ii) Age-specific fertility rate iii) Total fertility rate iv) Gross reproduction rate v) Plot a graph showing the age-specific fertility rate (ASFR) in Ubekizakhan and explain the variations.The CDC (Center for Disease Control) did a study to see if there is an association between lung cancer and exposure to asbestos (this data set has been made up. However, my understanding is that the association has already been proven). The doctors at the CDC took a SRS of 20 people with lung cancer and a SRS of 30 people without lung cancer. Suppose the incidence of lung cancer is 1 out of every 1000 people (I made this number up).Let C = a randomly selected person has lung cancerLet E = a randomly selected person has been exposed to asbestosUse 3 decimal places for the following questions.P(C | E) =A botanist opened a sample of 50 bean pods and counted the number of beans in each pod. The results obtained were as follows: 3 0 4 2 3 1 2 3 1 0 5 0 3 6 0 3 5 4 5 3 5 5 1 1 0 0 0 5 0 1 5 3 6 4 5 6 1 5 3 6 1 0 6 2 1 1 1 1 4 6 the frequency table for these data. Number of Beans in Pod Number of Bean Pods 0 9 1 11 2 3 3 8 4 4 5 9 6 6 Determine the range of variation:(X¯-S,X¯+S) = ( , )Round your answers to 2 decimal places as needed. Calculate what percent of the data values are within one standard deviation of the mean.Hint: Create a histogram on paper and shade the included region(s) on your histogram to help visualize the shaded area and help with calculations.Total area of shaded region = Round your answer to 2 decimal places as needed.Percent of area within one standard deviation =Round your answer to 2 decimal places as needed.
