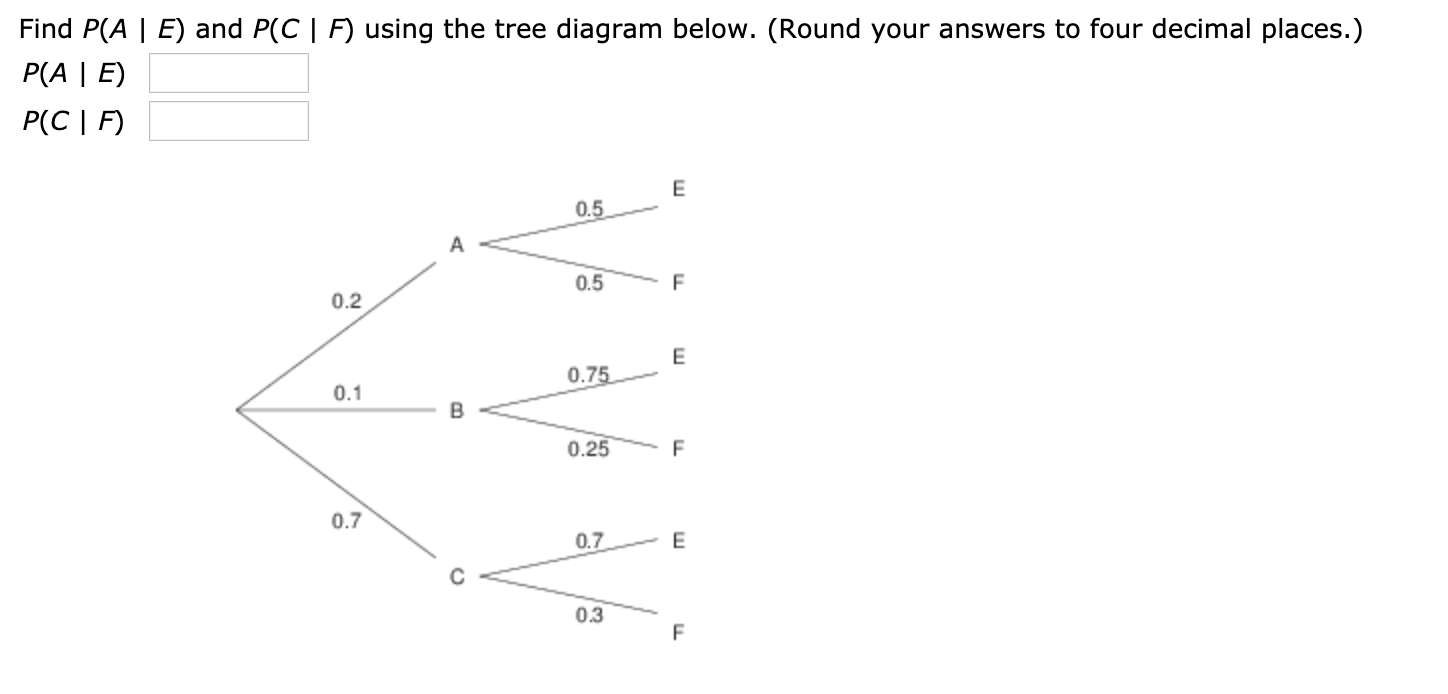
Find P(A | E) and P(C | F) using the tree diagram below. (Round your answers to four decimal places.) P(A | E) P(C | F) E 0.5 A 0.5 F 0.2 E 0.75 0.1 0.25 0.7 0.7 0.3 F


Q: Day Frequency, f A bicycle safety organization claims that fatal bicycle accidents are uniformly…
A: A bicycle safety organization claims that fatal bicycle accidents are uniformly distributed…
Q: The data in the accompanying table represent the heights and weights of a random sample of…
A: The data shows the heights and weights of a random sample of professional baseball players.
Q: Consider this scenario: The profit of a company decreased steadily over a ten-year span. The profit…
A:
Q: G The following table gives the prices and quantities of four commodities A, B. C and D Go the years…
A:
Q: A store manager hypothesizes that the average number of pages a person copies on the store's copy…
A: Given data: Number of customers' orders selected in the sample is, n = 36 32 29 49…
Q: A teacher wishes to see whether a new smartphone app will reduce the number of grammatical errors…
A:
Q: 1. A biologist conducted a study to assess the effects of a particular medication on managing the…
A: Introduction: Denote μE, μC as the true mean scores for the experimental and control groups,…
Q: You want to buy a microwave oven and will choose Model A if its repair costs are lower than Model…
A: μ1 = mean repair cost of model A μ2 = mean repair cost of model B Null Hypothesis : H0 : μ1 ≥ μ2…
Q: BICDF 1. 1. 1. 1. 3. 3. 8. 4. 5. 9. Grade Men Women Final Here is data for a math class:
A:
Q: rollowing data, à Vênn diagram and then answer the following questions by filling in each blank with…
A:
Q: Use a two period binomial tree to price a 12 month European style put option on YMMV struck at $16.…
A:
Q: Education Level and Health Insurance A researcher wishes to see if the number of adults who do not…
A: Hi! Thank you for the question, As per the honor code, we are allowed to answer three sub-parts at a…
Q: During the early morning hours, customers arrive at a branch post office at an average rate of 15…
A: Given information: Arrival rate=λ=15 per hourService rate=μ=5 per hourClerk cost=$38.22Waiting…
Q: PULL STRENGTH Choose the correct P-value. O 1.07546E-19 0.000188266 0.04409945 O 3.90691E-19
A: We need to find P-value associated with Pull strength
Q: In each graph, the shaded region represents the P-value of a hypothesis te Find the P-value, given…
A:
Q: Directions: Solve the following problems In each of the following, draw and identify the region…
A: The critical value is tcritical=1..771. we have get the left side of the critical value shaded.
Q: Credit Cards Draw and analyze a pie graph for the number of credit cards a person has. Number of…
A: Pie Chart: It is one of the types of charts that divides a circle into different parts. In general,…
Q: Weight Gain of Athletes A researcher wishes to see whether there is any difference in the weight…
A: Solution
Q: b. Here is a two-way table of the data. Regular Occasional No Total What proportion of males…
A: We are asked to look at parts d) and i) only here.
Q: Group I Group II N2 = 30 Given N = 20 E(X- 8) = 10 E(X-8)2 = 152 (Y- 10) = - 15 E(Y- 10)2 = 300 %3D…
A:
Q: Briefly explain how increasing sample size influences each of the following. Assume that all other…
A: 2) If the z-score is increases then that means there is a significant effect and reject the null…
Q: The boxplột below shows salaries for Construction workers and Teachers. Construction Teacher 20 25…
A: Given box plot: The box plot contains 5-number summary. That is, the minimum value, the first…
Q: ПСП тергеsеп ers of Use a pie chart to display the datad, student loan borrowers (in millions) by…
A: Pie chart is a graph which explains the relative frequencies of different categories of the data set…
Q: Assignment 3- Classification Gini 1. We will use the dataset below to learn a decision tree which…
A:
Q: C. Given the null and alternative hypotheses in synibol, determine the hypothesis test used…
A: From the above table 1) Hypothesis H0 : μ = 25 H1 : μ < 25 Hypothesis test used Left talied…
Q: (5.) As mobile phones continue to proliferate, more and more people will watch video content on…
A:
Q: 1. A biologist conducted a study to assess the effects of a particular medication on managing the…
A: Analysis of variance (ANOVA) is a hypothesis test, which is used when we cannot use a t-test for the…
Q: A chain of video stores sells three different brands of DVD players. Of its DVD player sales, 48%…
A: The conditional probability of happening of event A when event B already happened, can be expressed…
Q: Both data sets have You are applying for a job at two companies. Company A offers starting salaries…
A: To find: From which company are you more likely to get an offer of $32,000 or more?
Q: Directions: Solve the following problems In each of the following, draw and identify the region…
A: 1) The critical value is tcritical=3.143 we have to get the right side of the distribution shaded.
Q: population has = 60 and = 10. Find the z-score corresponding to each of the following sample…
A:
Q: Juestion 3: When a person enters a Gym-club he must pay LE 30 and he has to pay LE 15 for each game…
A:
Q: A corn breeder wishes to improve yield. As part of their work, the narrow-sense heritability for…
A: Given that: A corn breeder wishes to improve yield. As part of their work, the narrow-sense…
Q: The table shows the performance of a selection of 98 stocks after one year. (Take S to be the set of…
A:
Q: The "fill" problem is important in many industries, such as those making cereal, toothpaste, beer,…
A: Given , the distribution of X is N501, σ2 P( X < 500 ) = 0.008 We have to find standard deviation…
Q: Twins In 2009 a national vital statistics report indicatedthat about 3% of all births produced…
A:
Q: Recall that Benford's Law claims that numbers chosen from very large data fles tend to have "1 as…
A:
Q: FROM NON LINEAR TO LINEAR TEXT. Directions: Research on the number of confirmed cases of COVID-19 in…
A:
Q: 8.0% 25.0% 12.0% 10.0% 45.0% Cricket Football Tennis Basketball I Volleyball The given pie chart…
A:
Q: Copy Machine Use A store manager hypothesizes that the average number of pages a person copies on…
A: Given Information: Population mean (u) = 40 Standard deviation (σ) = 30.9 Sample mean can be…
Q: Somehow you manage to build a fair 3-sided die, equally likely to show 1, 2, or 3 every time it is…
A: It is given that the results are independent and 3 sided die is rolled twice, so the sample space…
Q: Cancer is a disease caused by abnormal growth and proliferation of cells in the body. A model is…
A:
Q: At a=0.005, can the researcher conclude that there is a difference in the diets? Diet A: 3,…
A:
Q: ng Find the median, first quartile (Q Previous e third quartile (Q3) for the data shown, which is…
A:
Q: Weight Gain of Athletes A researcher wishes to see whether there is any difference in the weight…
A: 1) The researcher checking whether there is any difference in the weight gains of athletes in one of…
Q: n the following plot you see the rejection frequencies (defined as the frequency in which the…
A:
Q: Messages arrive at a switchboard in a Poisson manner at an average rate of three per hour. Let X be…
A:
Q: Humber of Staff NEWS MAGAZINE STAFF SIZE OVER TIME Time and Newsweek select years 1983 - 2005 320…
A: Univariate data takes only one variable at a time. Bivariate data compare two variables.
Q: P = 0.8 0.2 , and T = 0.3 0.7 0.4 0.6. (a) What is the probability of moving from…
A: Hello. Since your question has multiple sub-parts, we will solve the first three sub-parts for you.…


Trending now
This is a popular solution!

Step by step
Solved in 3 steps with 3 images

- Find P(F | B) and P(E | A) using the tree diagram. (Round your answers to three decimal plac P(F | B) P(E | A)Find P(A | E) and P(C | F) using the tree diagram below. (Round your answers to four decimal places.) P(A | E) P(C | F)The table shows the weekly profits of a fruitvendor. What is the mean profit for these week
- Rest of the trading data on the second imageIf a researcher is interested in seeing if his group of students compares to the national average in terms of hours they study, which t-test design will he be using? -dependent (paired) samples t-test -one sample t-test -any t-test will work -independent samples t-testK:56) Somehow you manage to build a fair 3-sided die, equally likely to show 1, 2, or 3 every time it is rolled. You roll the die twice, with the results each time being independent. If X is the maximum of the 2 numbers rolled and Y is the sum of the 2 numbers rolled, find the correlation ρ(X, Y ).
- A survey of 185 public universities found that “the salaries and benefits of their presidents continued to rise, though at a slower rate than in years past.” Let ƒ(t) represent the total salary and compensation of the average public university president in year t. What does this statement tell us about ƒ(t), ƒ′(t), and ƒ″(t)? Source: The New York Times.Which of the following are true?A. At least a quarter of the data values in D2 are less than all of the data values in D3 .B. The median value for D1 is less than the median value for D3 .C. At least three quarters of the data values in D1 are less than all of the data values in D2 .D. The data in D3 is skewed right.E. Three quarters of the data values for D2 are greater than the median value for D1 .F. At least a quarter of the data values for D3 are less than the median value for D2 .Acid rain Based on long-term investigation, research-ers have suggested that the acidity (pH) of rainfall in the Shenandoah Mountains can be described by the Normalmodel N(4.9, 0.6).a) Draw and carefully label the model.b) What percent of storms produce rainfall with pHover 6?c) What percent of storms produce rainfall with pHunder 4?d) The lower the pH, the more acidic the rain. What isthe pH level for the most acidic 20% of all storms?e) What is the pH level for the least acidic 5% of allstorms?f) What is the IQR for the pH of rainfall?
- Classify each of the following as either quantitative or Qualitative (first blank) and either nominal, ordinal, interval or ratio (second blank): 1)The time an accountant spends at work during tax season. 2) The ordered preference that investors have for different types of investment funds. 3) The country where an individual is born. there are 2 for each one Plzz explainA special education teacher did research on whether or not there is a relationship between the number of students in his class and the number incidents of “acting out” behaviors exhibited by the autistic students in the classroom. He collects data for a year and aggregates them by month. He obtained the statistics below, r= -.863 R2=.74 b= -1.212294 a= 131.176598 10.) How does the presence of more students affect the incidents in the class? a) as students are added the incidences increase b) as students are added the incidences decrease c) the number of students does not affect acting out d) the number of students caused more incidents How much of the variability of acting out is explained by the number of students in the class?___________The data represent the age of world leaders on their day of inauguration. Find the five-number summary, and construct a boxplot for the data. Comment on the shape of the distribution. 694346424147476155554263454352 The five-number summary is _____, _____, _____, ______, ______
