
Algebra & Trigonometry with Analytic Geometry
13th Edition
ISBN:9781133382119
Author:Swokowski
Publisher:Swokowski
Chapter4: Polynomial And Rational Functions
Section4.5: Rational Functions
Problem 7E

Related questions
Question
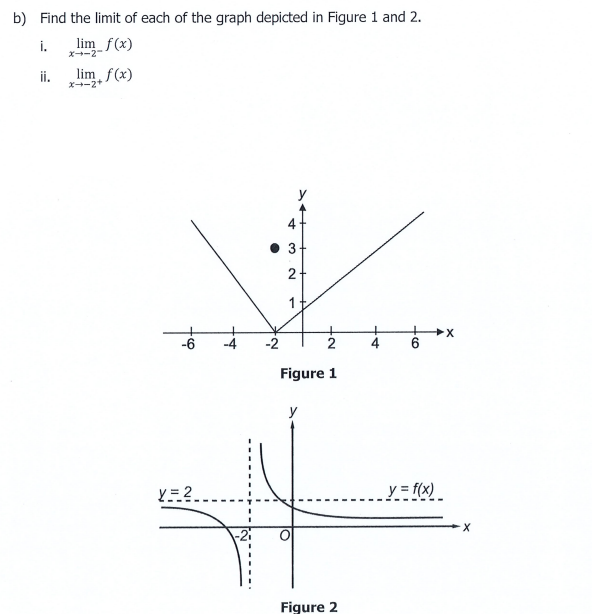
Transcribed Image Text:b) Find the limit of each of the graph depicted in Figure 1 and 2.
i.
ズ→ー2-
lim f(x)
ii.
x-2+
lim f(x)
3+
2+
-6
-2
4
Figure 1
Y= 2
y = f(x)
Figure 2
チ
す
Expert Solution
This question has been solved!
Explore an expertly crafted, step-by-step solution for a thorough understanding of key concepts.

Step by step
Solved in 3 steps with 2 images

Recommended textbooks for you
Algebra & Trigonometry with Analytic Geometry
Algebra
ISBN:
9781133382119
Author:
Swokowski
Publisher:
Cengage
Algebra & Trigonometry with Analytic Geometry
Algebra
ISBN:
9781133382119
Author:
Swokowski
Publisher:
Cengage