
Holt Mcdougal Larson Pre-algebra: Student Edition 2012
1st Edition
ISBN:9780547587776
Author:HOLT MCDOUGAL
Publisher:HOLT MCDOUGAL
Chapter7: Percents
Section: Chapter Questions
Problem 26CP

Related questions

Question
Question 10-
Transcribed Image Text:Chapter
12 Extra Practice
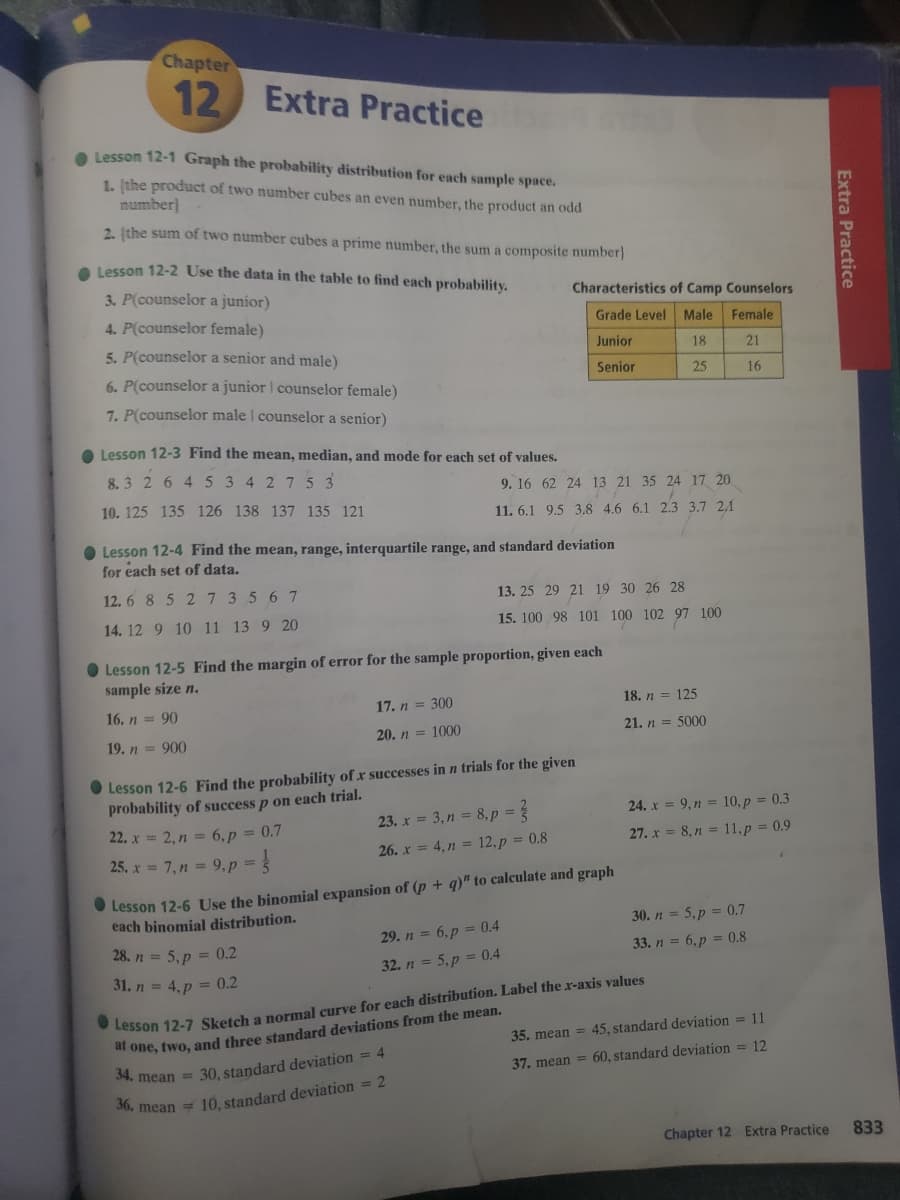
Lesson 12-1 Graph the probability distribution for each sample space.
1. (the product of two number cubes an even number, the product an odd
number)
2. (the sum of two number cubes a prime number, the sum a composite number)
e Lesson 12-2 Use the data in the table to find each probability.
3. P(counselor a junior)
Characteristics of Camp Counselors
4. P(counselor female)
Grade Level
Male
Female
5. P(counselor a senior and male)
Junior
18
21
6. P(counselor a junior I counselor female)
Senior
25
16
7. P(counselor male I counselor a senior)
Lesson 12-3 Find the mean, median, and mode for each set of values.
8. 3 2 6 4 5 3 4 275 3
9. 16 62 24 13 21 35 24 17 20
10. 125 135 126 138 137 135 121
11. 6.1 9.5 3.8 4.6 6.1 2.3 3.7 2,1
O Lesson 12-4 Find the mean, range, interquartile range, and standard deviation
for each set of data.
12. 6 8 5 2 7 3567
13. 25 29 21 19 30 26 28
14. 12 9 10 11 13 9 20
15. 100 98 101 100 102 97 100
O Lesson 12-5 Find the margin of error for the sample proportion, given each
sample size n.
17. n = 300
18. n = 125
16. n = 90
21. n = 5000
20. n = 1000
19. n = 900
O Lesson 12-6 Find the probability of x successes in n trials for the given
probability of success p on each trial.
24. x = 9,n = 10, p = 0.3
23. x = 3, n = 8, p =
22. x = 2, n = 6, p = 0.7
27. x = 8, n = 11,p = 0.9
26. x = 4, n = 12,p = 0.8
25. x = 7, n =9,p =
Lesson 12-6 Use the binomial expansion of (p + q)" to calculate and graph
each binomial distribution.
30. n = 5,p = 0.7
29. n = 6,p = 0.4
28. n = 5, p = 0.2
33. n = 6,p = 0.8
32. n = 5,p = 0.4
31. n = 4,p = 0.2
tesson 12-7 Sketch a normal curve for each distribution. Label the r-axis values
af one, two, and three standard deviations from the mean.
35. mean = 45, standard deviation = 11
37. mean = 60, standard deviation = 12
*. mean = 30, standard deviation = 4
. mean = 10, standard deviation = 2
Chapter 12 Extra Practice
833
Extra Practice
Expert Solution
This question has been solved!
Explore an expertly crafted, step-by-step solution for a thorough understanding of key concepts.

Step by step
Solved in 4 steps with 4 images

Knowledge Booster


Learn more about
Need a deep-dive on the concept behind this application? Look no further. Learn more about this topic, algebra and related others by exploring similar questions and additional content below.Recommended textbooks for you
Holt Mcdougal Larson Pre-algebra: Student Edition…
Algebra
ISBN:
9780547587776
Author:
HOLT MCDOUGAL
Publisher:
HOLT MCDOUGAL

College Algebra
Algebra
ISBN:
9781305115545
Author:
James Stewart, Lothar Redlin, Saleem Watson
Publisher:
Cengage Learning

Holt Mcdougal Larson Pre-algebra: Student Edition…
Algebra
ISBN:
9780547587776
Author:
HOLT MCDOUGAL
Publisher:
HOLT MCDOUGAL
College Algebra
Algebra
ISBN:
9781305115545
Author:
James Stewart, Lothar Redlin, Saleem Watson
Publisher:
Cengage Learning

Algebra & Trigonometry with Analytic Geometry
Algebra
ISBN:
9781133382119
Author:
Swokowski
Publisher:
Cengage

Algebra and Trigonometry (MindTap Course List)
Algebra
ISBN:
9781305071742
Author:
James Stewart, Lothar Redlin, Saleem Watson
Publisher:
Cengage Learning

Glencoe Algebra 1, Student Edition, 9780079039897…
Algebra
ISBN:
9780079039897
Author:
Carter
Publisher:
McGraw Hill