First image is an example on how to do this exercise. Table one is a reference I need help to find the target inventory, T Sam's Cat Hotel operates 52 weeks per year, 6 days per week. It purchases kitty litter for $8.00 per bag. The following information is available about these bags: ≻Demand = 55 bags/week ≻Order cost = $70/order ≻Annual holding cost = 22 percent of cost ≻Desired cycle-service level= 99 percent ≻Lead time = 4 week(s) (24 working days) ≻Standard deviation of weekly demand = 4 bags ≻Current on-hand inventory is 250 bags, with no open orders or backorders. Suppose that Sam's Cat Hotel uses a P system. The average daily demand, d, is 9 bags (55/6), and the standard deviation of daily demand, Standard Deviation of Weekly DemandDays per Week/square root of Days per Week, is 1.633 bags. Refer to the standard normal table for z-values. a. What P (in working days) and T should be used to approximate the cost trade-offs of the EOQ? The time between orders, P, should be 5252 days. (Enter your response rounded to the nearest whole number.) The target inventory, T, should be enter your response here bags. (Enter your response rounded to the nearest whole number.)
First image is an example on how to do this exercise. Table one is a reference I need help to find the target inventory, T Sam's Cat Hotel operates 52 weeks per year, 6 days per week. It purchases kitty litter for $8.00 per bag. The following information is available about these bags: ≻Demand = 55 bags/week ≻Order cost = $70/order ≻Annual holding cost = 22 percent of cost ≻Desired cycle-service level= 99 percent ≻Lead time = 4 week(s) (24 working days) ≻Standard deviation of weekly demand = 4 bags ≻Current on-hand inventory is 250 bags, with no open orders or backorders. Suppose that Sam's Cat Hotel uses a P system. The average daily demand, d, is 9 bags (55/6), and the standard deviation of daily demand, Standard Deviation of Weekly DemandDays per Week/square root of Days per Week, is 1.633 bags. Refer to the standard normal table for z-values. a. What P (in working days) and T should be used to approximate the cost trade-offs of the EOQ? The time between orders, P, should be 5252 days. (Enter your response rounded to the nearest whole number.) The target inventory, T, should be enter your response here bags. (Enter your response rounded to the nearest whole number.)

Purchasing and Supply Chain Management
6th Edition
ISBN:9781285869681
Author:Robert M. Monczka, Robert B. Handfield, Larry C. Giunipero, James L. Patterson
Publisher:Robert M. Monczka, Robert B. Handfield, Larry C. Giunipero, James L. Patterson
Chapter16: Lean Supply Chain Management
Section: Chapter Questions
Problem 10DQ: The chapter presented various approaches for the control of inventory investment. Discuss three...

Related questions
Question
First image is an example on how to do this exercise.
Table one is a reference
I need help to find the target inventory, T
Sam's Cat Hotel operates 52 weeks per year, 6 days per week. It purchases kitty litter for $8.00 per bag. The following information is available about these bags:
≻Demand = 55 bags/week
≻Order cost = $70/order
≻Annual holding cost = 22 percent of cost
≻Desired cycle-service level= 99 percent
≻Lead time = 4 week(s) (24 working days)
≻Standard deviation of weekly demand = 4 bags
≻Current on-hand inventory is 250 bags, with no open orders or backorders.
Suppose that Sam's Cat Hotel uses a P system. The average daily demand, d, is 9 bags (55/6), and the standard deviation of daily demand,
Standard Deviation of Weekly DemandDays per Week/square root of Days per Week, is 1.633 bags. Refer to the standard normal table
for z-values.
a. What P (in working days) and T should be used to approximate the cost trade-offs of the EOQ?
The time between orders, P, should be 5252 days. (Enter your response rounded to the nearest whole number.)
The target inventory, T, should be enter your response here
bags. (Enter your response rounded to the nearest whole number.)
bags. (Enter your response rounded to the nearest whole number.)
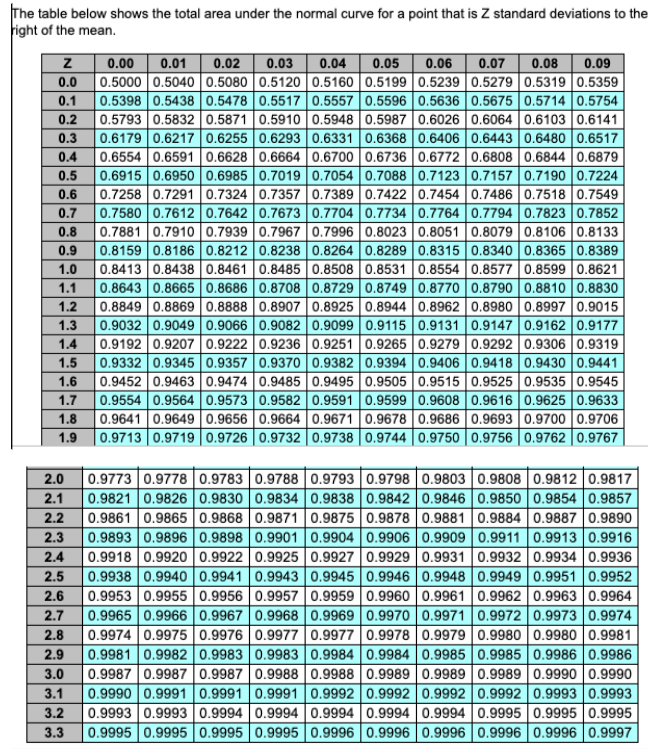
Transcribed Image Text:The table below shows the total area under the normal curve for a point that is Z standard deviations to the
right of the mean.
0.00
0.5000 0.5040 0.5080 0.5120 0.5160 0.5199 0.5239 0.5279 0.5319 0.5359
0.1
0.01
0.02
0.03
0.04 0.05
0.06
0.07
0.08
0.09
0.0
0.5398 0.5438 0.5478 0.5517 0.5557 0.5596 0.5636 0.5675 0.5714 0.5754
0.5793 0.5832 0.5871 0.5910 0.5948 0.5987 0.60260.6064 0.6103 0.6141
0.6179 0.6217 0.6255 0.6293 0.6331 0.6368 0.6406 0.6443 0.6480 0.6517
0.6554 0.6591 0.6628 0.6664 0.6700 0.6736 0.6772 0.6808 0.6844 0.6879
0.6915 0.6950 0.6985 0.7019 0.7054 0.7088 0.71230.7157 0.7190 0.7224
0.7258 0.7291 0.7324 0.7357 0.7389 0.7422 0.74540.7486 0.7518 0.7549
0.7580 0.7612 0.7642 0.7673 0.7704 0.7734 0.7764 0.7794 0.7823 0.7852
0.7881 0.7910 0.7939 0.7967 0.7996 0.8023 0.80510.8079 0.8106 0.8133
0.8159 0.8186 0.8212 0.8238 0.8264 0.8289 0.83150.8340 0.8365 0.8389
0.8413 0.8438 0.8461 0.8485 0.8508 0.8531 0.85540.8577 0.8599 0.8621
0.8643 0.8665 0.8686 0.8708 0.8729 0.8749 0.8770 0.8790 0.8810 0.8830
0.8849 0.8869 0.8888 0.8907 0.8925 0.8944 0.89620.8980 0.8997 0.9015
0.9032 0.9049 0.9066 0.9082 0.9099 0.9115 0.91310.9147 0.9162 0.9177
0.9192 0.9207 0.9222 0.9236 0.9251 0.9265 0.9279 0.9292 0.9306 0.9319
0.9332 0.9345 0.9357 0.9370 0.9382 0.9394 0.9406 0.9418 0.9430 0.9441
0.9452 0.9463 0.9474 0.9485 0.9495 0.9505 0.95150.9525 0.9535 0.9545
0.9554 0.9564 0.9573 0.9582 0.9591 0.9599 0.9608 0.9616 0.9625 0.9633
0.9641 0.9649 0.9656 | 0.9664 0.9671 0.9678 0.9686 0.9693 0.9700 0.9706
0.9713 0.9719 |0.9726 | 0.9732 | 0.9738 | 0.9744 | 0.9750 | 0.9756 | 0.9762 | 0.9767
0.2
0.3
0.4
0.5
0.6
0.7
0.8
0.9
1.0
1.1
1.2
1.3
1.4
1.5
1.6
1.7
1.8
1.9
|0.9773 0.9778 0.9783 0.9788 0.9793 0.9798 0.9803 0.9808 0.9812 0.9817
0.9821 0.9826 0.9830 0.9834 0.9838 0.9842 0.9846 0.9850 0.9854 0.9857
|0.9861 0.9865 0.9868 0.9871 0.9875 0.9878 0.9881 0.9884 0.9887 0.9890
|0.9893 0.9896 0.9898 0.9901 0.9904 0.9906 0.9909 0.9911 0.9913 0.9916
0.9918 0.9920 0.9922 0.9925 0.9927 0.9929 0.9931 0.9932 0.9934 0.9936
2.5
2.0
2.1
2.2
2.3
2.4
0.9938 0.9940 0.9941 0.9943 0.9945 0.9946 0.9948 0.9949 0.9951 0.9952
0.9953 0.9955 0.9956 0.9957 0.9959 0.9960 0.9961 0.9962 0.9963 0.9964
0.9965 0.9966 0.9967 0.9968 0.9969 0.9970 0.9971 0.9972 0.9973 0.9974
0.9974 0.9975 0.9976 0.9977 0.9977 0.9978 0.9979 0.9980 0.9980 0.9981
0.9981 0.9982 0.9983 0.9983 0.9984 0.9984 0.9985 0.9985 0.9986 0.9986
0.9987 0.9987 0.9987 0.9988 0.9988 0.9989 0.9989 0.9989 0.9990 0.9990
0.9990 0.9991 0.9991 0.9991 0.9992 0.9992 0.9992 0.9992 0.9993 0.9993
0.9993 0.9993 0.9994 0.9994 0.9994 0.9994 0.9994 | 0.9995 0.9995 0.9995
0.9995 0.9995 0.9995 0.9995 0.99960.9996 0.9996 0.9996 0.9996 0.9997
2.6
2.7
2.8
2.9
3.0
3.1
3.2
3.3
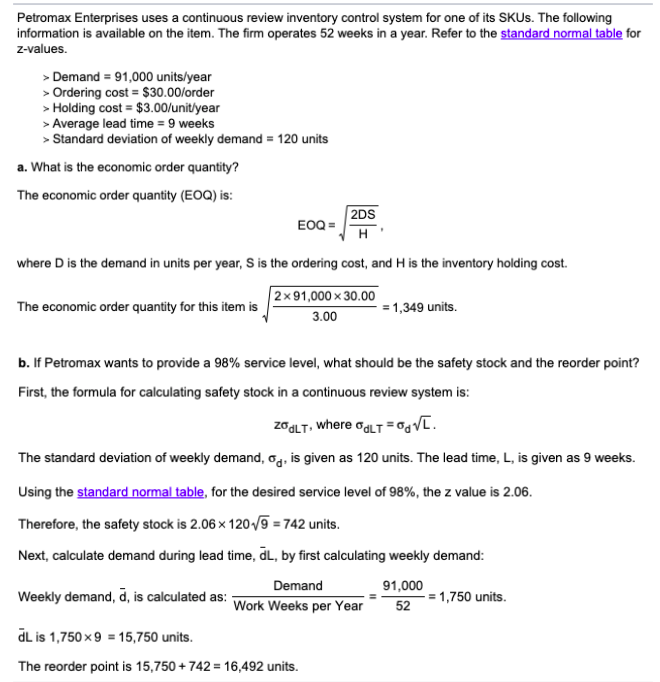
Transcribed Image Text:Petromax Enterprises uses a continuous review inventory control system for one of its SKUS. The following
information is available on the item. The firm operates 52 weeks in a year. Refer to the standard normal table for
z-values.
> Demand = 91,000 units/year
> Ordering cost = $30.00/order
> Holding cost = $3.00/unit/year
> Average lead time = 9 weeks
> Standard deviation of weekly demand = 120 units
a. What is the economic order quantity?
The economic order quantity (EOQ) is:
2DS
EOQ =
H
where D is the demand in units per year, S is the ordering cost, and H is the inventory holding cost.
2x91,000 x 30.00
The economic order quantity for this item is
= 1,349 units.
3.00
b. If Petromax wants to provide a 98% service level, what should be the safety stock and the reorder point?
First, the formula for calculating safety stock in a continuous review system is:
zagLT, where ogLT =0gV[.
The standard deviation of weekly demand, og, is given as 120 units. The lead time, L, is given as 9 weeks.
Using the standard normal table, for the desired service level of 98%, the z value is 2.06.
Therefore, the safety stock is 2.06 x 120/9 = 742 units.
Next, calculate demand during lead time, dL, by first calculating weekly demand:
Demand
Weekly demand, d, is calculated as: -
91,000
-= 1,750 units.
Work Weeks per Year
52
dL is 1,750 x9 = 15,750 units.
The reorder point is 15,750 + 742 = 16,492 units.
Expert Solution
This question has been solved!
Explore an expertly crafted, step-by-step solution for a thorough understanding of key concepts.

This is a popular solution!

Trending now
This is a popular solution!

Step by step
Solved in 2 steps

Recommended textbooks for you
Purchasing and Supply Chain Management
Operations Management
ISBN:
9781285869681
Author:
Robert M. Monczka, Robert B. Handfield, Larry C. Giunipero, James L. Patterson
Publisher:
Cengage Learning
Purchasing and Supply Chain Management
Operations Management
ISBN:
9781285869681
Author:
Robert M. Monczka, Robert B. Handfield, Larry C. Giunipero, James L. Patterson
Publisher:
Cengage Learning