For a group of four 60-year old men, the probability distribution for the number x who live through the next year is as given in the table below. P(a) 0.0009 1 0.0171 0.1228 0.3914 4 0.4678 Verify that the table is indeed a probability distribution. Then find the mean of the distribution. mean = Report answer accurate to 1 decimal place.
For a group of four 60-year old men, the probability distribution for the number x who live through the next year is as given in the table below. P(a) 0.0009 1 0.0171 0.1228 0.3914 4 0.4678 Verify that the table is indeed a probability distribution. Then find the mean of the distribution. mean = Report answer accurate to 1 decimal place.

Chapter9: Sequences, Probability And Counting Theory
Section9.7: Probability
Problem 1SE: What term is used to express the likelihood of an event occurring? Are there restrictions on its...

Related questions
Question
For a group of four 60-year old men, the probability distribution for the number x who live through the next year is as given in the table below.
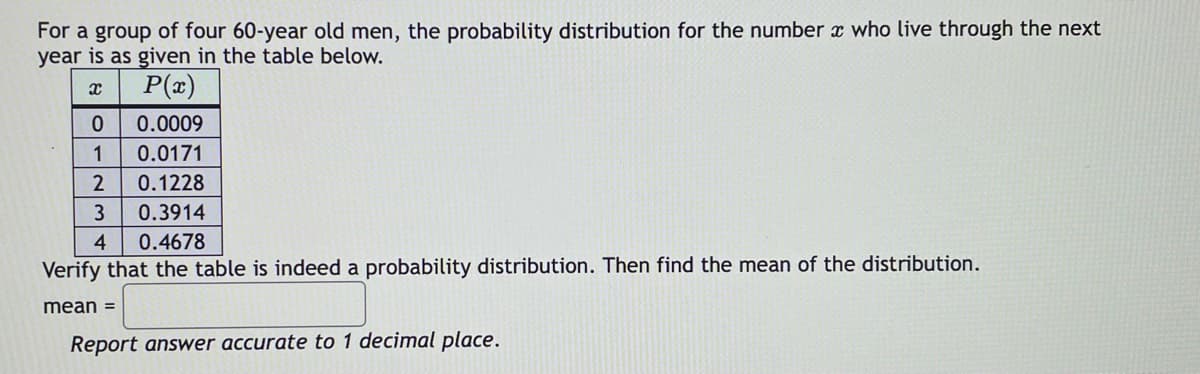
Transcribed Image Text:For a group of four 60-year old men, the probability distribution for the number x who live through the next
year is as given in the table below.
P(x)
0.0009
1
0.0171
2
0.1228
0.3914
4
0.4678
Verify that the table is indeed a probability distribution. Then find the mean of the distribution.
mean =
Report answer accurate to 1 decimal place.
Expert Solution
This question has been solved!
Explore an expertly crafted, step-by-step solution for a thorough understanding of key concepts.

This is a popular solution!

Trending now
This is a popular solution!

Step by step
Solved in 3 steps with 2 images

Recommended textbooks for you