For a sample whose observations, 5, 12, 3, 7, 11, 1, 85, 5, 9, and 5, represent the number of medical leaves claimed by 10 employees of a company in a year, which of the following appears to be the best measure of the center of the data?
For a sample whose observations, 5, 12, 3, 7, 11, 1, 85, 5, 9, and 5, represent the number of medical leaves claimed by 10 employees of a company in a year, which of the following appears to be the best measure of the center of the data?

Glencoe Algebra 1, Student Edition, 9780079039897, 0079039898, 2018
18th Edition
ISBN:9780079039897
Author:Carter
Publisher:Carter
Chapter10: Statistics
Section10.5: Comparing Sets Of Data
Problem 14PPS

Related questions
Question
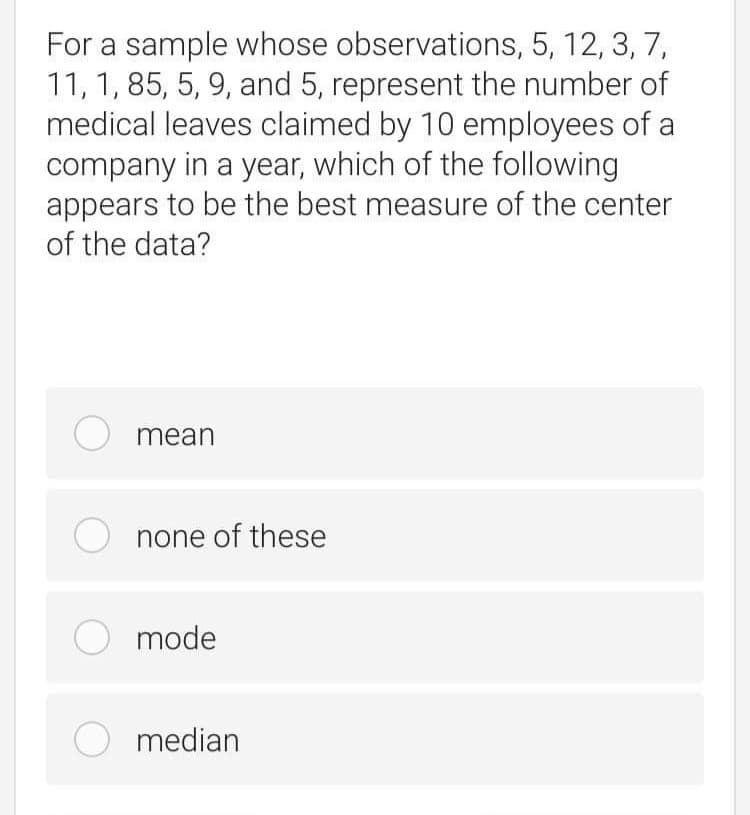
Transcribed Image Text:For a sample whose observations, 5, 12, 3, 7,
11, 1, 85, 5, 9, and 5, represent the number of
medical leaves claimed by 10 employees of a
company in a year, which of the following
appears to be the best measure of the center
of the data?
O mean
none of these
O mode
O median
Expert Solution
This question has been solved!
Explore an expertly crafted, step-by-step solution for a thorough understanding of key concepts.

Step by step
Solved in 2 steps

Recommended textbooks for you
Glencoe Algebra 1, Student Edition, 9780079039897…
Algebra
ISBN:
9780079039897
Author:
Carter
Publisher:
McGraw Hill
Glencoe Algebra 1, Student Edition, 9780079039897…
Algebra
ISBN:
9780079039897
Author:
Carter
Publisher:
McGraw Hill