For Checkpoint C you will extend Checkpoint B to do the following: 1. Track and then output a summary report that features o the average kelp population across the simulated timescale, o the average urchin population across the simulated timescale, o the minimum kelp population observed during the simulation, o the maximum urchin population observed during the simulation. Hint: your program will employ the min-finding and max-finding patterns we learned in class with for-loops. Sample Output Sample input/output behavior for the checkpoint are provided below. Your program's spacing, spelling, capitalization, and punctuation will need to match the sample output EXACTLY for this project. Ex 1 Sample Input/Output Given inputs a, 8, 7, 6, ko, uo, nas: 1.5 -001 .05 2.5 100 2 10 The program outputs ==>Bull Kelp and Purple Urchin Population Simulator <== --- Model Parameters Kelp growth rate: Kelp death rate: Urchin birth rate: Urchin death rate: ---Initial Population Kelp population (in thousands) at t = 0: Urchin population (in thousands) at t = 0: --- Simulation --- Timescale: Time t = 0: 100.000k kelp, 2.000k urchins 249.800k kelp, 7.000k urchins Time t = 1: Time t = 2: 622.751k kelp, 76.930k urchins 1508.970k kelp, 2280.018k urchins Time t = 3: Time t = 4: Time t = 5: Time t = 6: 331.946k kelp, 168603.957k urchins 0.000k kelp, 2545463.659k urchins 0.000k kelp, 0.000k urchins Time t = 7: 0.000k kelp, 0.000k urchins Time t = 8: 0.000k kelp, 0.000k urchins Time t = 9: 0.000k kelp, 0.000k urchins Time t = 10: 0.000k kelp, 0.000k urchins --- Simulation Statistics --- Average kelp population: 255.770k Average urchin population: 246948.506k Min kelp population was 0.000k at t=5.000 Max urchin population was 2545463.659k at t=5.000
For Checkpoint C you will extend Checkpoint B to do the following: 1. Track and then output a summary report that features o the average kelp population across the simulated timescale, o the average urchin population across the simulated timescale, o the minimum kelp population observed during the simulation, o the maximum urchin population observed during the simulation. Hint: your program will employ the min-finding and max-finding patterns we learned in class with for-loops. Sample Output Sample input/output behavior for the checkpoint are provided below. Your program's spacing, spelling, capitalization, and punctuation will need to match the sample output EXACTLY for this project. Ex 1 Sample Input/Output Given inputs a, 8, 7, 6, ko, uo, nas: 1.5 -001 .05 2.5 100 2 10 The program outputs ==>Bull Kelp and Purple Urchin Population Simulator <== --- Model Parameters Kelp growth rate: Kelp death rate: Urchin birth rate: Urchin death rate: ---Initial Population Kelp population (in thousands) at t = 0: Urchin population (in thousands) at t = 0: --- Simulation --- Timescale: Time t = 0: 100.000k kelp, 2.000k urchins 249.800k kelp, 7.000k urchins Time t = 1: Time t = 2: 622.751k kelp, 76.930k urchins 1508.970k kelp, 2280.018k urchins Time t = 3: Time t = 4: Time t = 5: Time t = 6: 331.946k kelp, 168603.957k urchins 0.000k kelp, 2545463.659k urchins 0.000k kelp, 0.000k urchins Time t = 7: 0.000k kelp, 0.000k urchins Time t = 8: 0.000k kelp, 0.000k urchins Time t = 9: 0.000k kelp, 0.000k urchins Time t = 10: 0.000k kelp, 0.000k urchins --- Simulation Statistics --- Average kelp population: 255.770k Average urchin population: 246948.506k Min kelp population was 0.000k at t=5.000 Max urchin population was 2545463.659k at t=5.000

Database System Concepts
7th Edition
ISBN:9780078022159
Author:Abraham Silberschatz Professor, Henry F. Korth, S. Sudarshan
Publisher:Abraham Silberschatz Professor, Henry F. Korth, S. Sudarshan
Chapter1: Introduction
Section: Chapter Questions
Problem 1PE

Related questions
Question
How to solve checkpoint c while using this python code
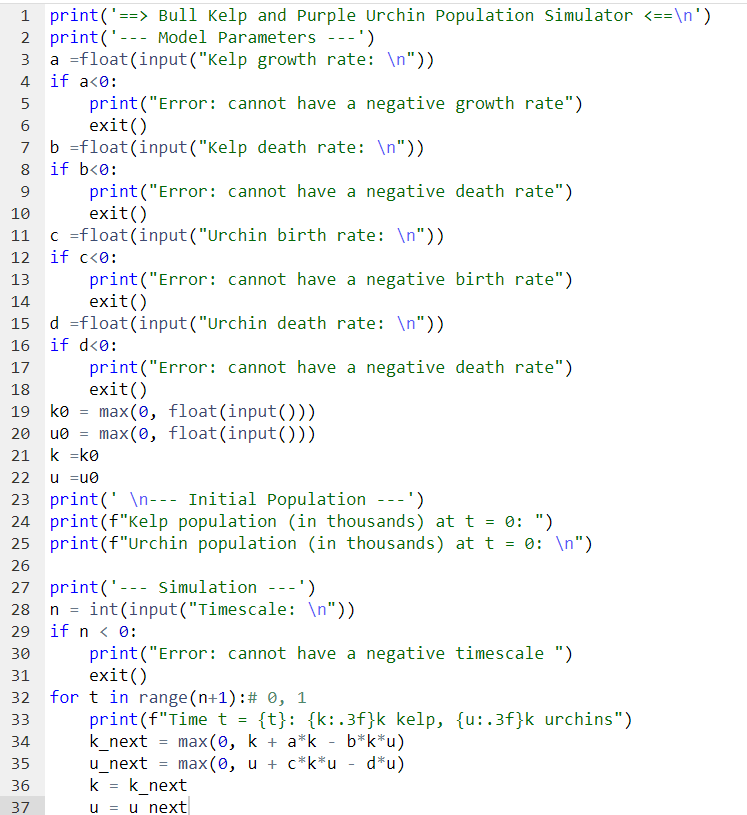
Transcribed Image Text:1 print('==> Bull Kelp and Purple Urchin Population Simulator <==\n')
2 print('- Model Parameters ---')
a float(input ("Kelp growth rate: \n"))
if a<0:
print("Error: cannot have a negative growth rate")
exit()
b =float(input("Kelp death rate: \n"))
8 if b<0:
9
10
11 c =float
12 if c<0:
13
14
4
5
6
16
17
18
19 ko
29
30
31
print("Error: cannot have a negative death rate")
exit()
ko = max(0, float(input()))
20 u0= max(0, float(input()))
21
k =k0
33
34
35
22
u =u0
23 print( \n--- Initial Population ---')
24 print (f"Kelp population (in thousands) at t = 0: ")
25 print (f"Urchin population (in thousands) at t = 0: \n")
26
27 print('--- Simulation ---')
m m m
print("Error:
exit()
36
(input("Urchin birth rate: \n"))
print("Error: cannot have a negative birth rate")
exit()
d =float (input ("Urchin death rate: \n"))
if d<0:
37
cannot have a negative death rate")
n = int(input("Timescale: \n"))
if n < 0:
print("Error: cannot have a negative timescale ")
exit()
for t in range (n+1): # 0, 1
print (f"Time t = {t}: {k:.3f}k kelp, {u:.3f}k urchins")
k_next = max(0, k + a*k - b*k*u)
u_next
max (0, u + c*k*u - d*u)
k = k_next
u = u next
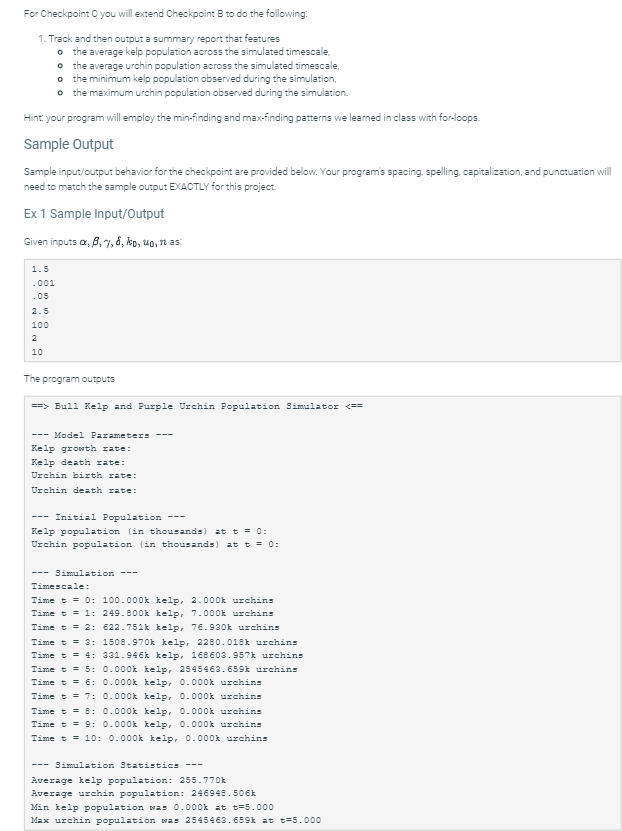
Transcribed Image Text:For Checkpoint C you will extend Checkpoint B to do the following:
1. Track and then output a summary report that features
0 the average kelp population across the simulated timescale,
o the average urchin population across the simulated timescale,
o the minimum kelp population observed during the simulation,
o the maximum urchin population observed during the simulation.
Hint: your program will employ the min-finding and max-finding patterns we learned in class with for-loops.
Sample Output
Sample input/output behavior for the checkpoint are provided below. Your program's spacing, spelling, capitalization, and punctuation will
need to match the sample output EXACTLY for this project.
Ex 1 Sample Input/Output
Given inputs xx, 6, 7, 8, ko, uo, n as:
1.5
-001
.05
2.5
100
2
10
The program outputs
==> Bull Kelp and Purple Urchin Population Simulator <==
---Model Parameters
Kelp growth rate:
Kelp death rate:
Urchin birth rate:
Urchin death rate:
Initial Population
Kelp population (in thousands) at t = 0:
Urchin population (in thousands) at t = 0:
--- Simulation ---
Timescale:
Time t = 0: 100.000k kelp, 2.000k urchins
Time t = 1: 249.800k kelp, 7.000k urchins
Time t = 2: 622.751k kelp, 76.930k urchins
Time t = 3:
Time t = 4:
Time t = 5:
Time t = 6:
Time t = 7:
1508.970k kelp, 2280.018k urchins
331.946k kelp, 168603.957k urchins
0.000k kelp, 2545463.659k urchins
0.000k kelp, 0.000k urchins
0.000k kelp, 0.000k urchins
Time t = 8: 0.000k kelp, 0.000k urchins
Time t = 9: 0.000k kelp, 0.000k urchins
Time t = 10: 0.000k kelp, 0.000k urchins
--- Simulation Statistics ---
Average kelp population: 255.770k
Average urchin population: 246948.506k
Min kelp population was 0.000k at t=5.000
Max urchin population was 2545463.659k at t=5.000
Expert Solution
Step 1: Algorithm
- Display the header for the simulation program.
- Display model parameters and input kelp growth rate (a), death rate (b), urchin birth rate (c), and death rate (d). Exit if any input is negative.
- Input initial kelp population (k0) and urchin population (u0), ensuring they're non-negative.
- Display the initial population values.
- Input the simulation timescale (n), ensuring it's non-negative.
- Initialize variables
avgk,avgu,mink, andminu. - Perform a loop for each time step from 0 to
n: a. Display current kelp and urchin populations. b. Calculate next kelp population (k_next) and next urchin population (u_next) based on the model equations. c. Update cumulative average kelp and urchin populations (avgk,avgu). d. Track minimum kelp and urchin populations (mink,minu). e. Update current kelp (k) and urchin (u) populations. - Display the average and minimum kelp and urchin populations over the simulation period.

Trending now
This is a popular solution!

Step by step
Solved in 4 steps with 2 images

Knowledge Booster


Learn more about
Need a deep-dive on the concept behind this application? Look no further. Learn more about this topic, computer-science and related others by exploring similar questions and additional content below.Recommended textbooks for you
Database System Concepts
Computer Science
ISBN:
9780078022159
Author:
Abraham Silberschatz Professor, Henry F. Korth, S. Sudarshan
Publisher:
McGraw-Hill Education

Starting Out with Python (4th Edition)
Computer Science
ISBN:
9780134444321
Author:
Tony Gaddis
Publisher:
PEARSON

Digital Fundamentals (11th Edition)
Computer Science
ISBN:
9780132737968
Author:
Thomas L. Floyd
Publisher:
PEARSON
Database System Concepts
Computer Science
ISBN:
9780078022159
Author:
Abraham Silberschatz Professor, Henry F. Korth, S. Sudarshan
Publisher:
McGraw-Hill Education
Starting Out with Python (4th Edition)
Computer Science
ISBN:
9780134444321
Author:
Tony Gaddis
Publisher:
PEARSON
Digital Fundamentals (11th Edition)
Computer Science
ISBN:
9780132737968
Author:
Thomas L. Floyd
Publisher:
PEARSON

C How to Program (8th Edition)
Computer Science
ISBN:
9780133976892
Author:
Paul J. Deitel, Harvey Deitel
Publisher:
PEARSON

Database Systems: Design, Implementation, & Manag…
Computer Science
ISBN:
9781337627900
Author:
Carlos Coronel, Steven Morris
Publisher:
Cengage Learning

Programmable Logic Controllers
Computer Science
ISBN:
9780073373843
Author:
Frank D. Petruzella
Publisher:
McGraw-Hill Education