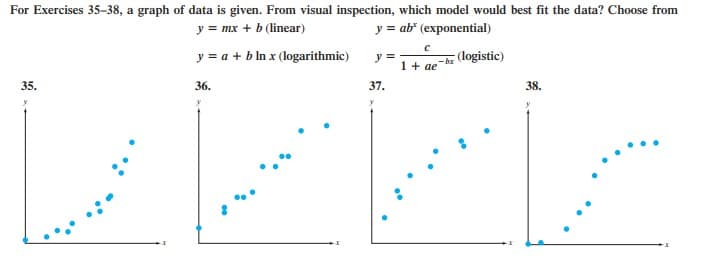
For Exercises 35-38, a graph of data is given. From visual inspection, which model would best fit the data? Choose from y = mx + b (linear) y = ab" (exponential) y = a + b ln x (logarithmic) y = 1+ ae (logistic) -hr 35. 36. 37. 38. y


Q: In a city of half a million, there are initially 800 cases of a particularly virulent strain of the…
A: Initial value=a=800Rate of increase=r=40%=0.4 Therefore logistic model of the potential cumulative…
Q: The population of a certain bacteria follows a logistic growth pattern. Initially, there are 10 g.…
A:
Q: In this exercise, we consider data from the Statistical Abstract of the United States on the…
A: Given that, The fraction of women who reached their fifth anniversary was 0.928. For each year…
Q: city of half a million, there are initially 400 cases of a particularly virulent strain of flu. The…
A:
Q: Complete the table** 1) A sample of data is collected (from 1999 and 2000) concerning the…
A: Solution: Given information: n= 1000 observation. k= 6 independent variables p= 7 total number of…
Q: Is the logistic equation separable?
A:
Q: Describe Mathematical derivation for graphical assessment of exponential and Weibull Models
A: Here we have to describe Mathematical derivation for graphical assessment of exponential and Weibull…
Q: In 1989, research scientists published a model for predicting the cumulative number of AIDS cases…
A: In 1989,research scientists published a model for predictingthe cumulative number of AIDS cases…
Q: What is the logistic equation? Why is it useful?
A: To write about the logistic equation and its use.
Q: (5) log yz (6) log (7) log (ry) (8) log rvz
A: We will find the value of these problem using logarithm formula. We know , log(A/B) = log(A) -…
Q: According to U.S. world census data, the world population in 1995 was 5,690,865,776 with a natural…
A: Logistic Model: A logistic model is used to model the population growth. In this model, the growth…
Q: The table shows the population of a certain city for selected years between 1950 and 2003. Years…
A: Given information: The data represents the values of the variables x = Year and y = Population.
Q: The mass of a radioactive substance follows a continuous exponential decay model, with a decay rate…
A: We are given decaying rate r=7%r=0.07
Q: Assume the carrying capacity of the earth is 11 billion. Use the 1960s peak annual growth rate…
A: According to the given information it is required to predict the base growth rate and current growth…
Q: The growth in the number (in millions) of Internet users in a certain country between 1990 and 2019…
A:
Q: The accompanying table shows the number of bacteria present in a certain culture over al4 hour…
A: Explanation of the answer is as follows
Q: That half-life of Plutonium-230 is 24,000 years. If 10 grams are present now, about how many years…
A: Consider the equation
Q: A male child is 18 inches long at birth and will grow to a height of 73 inches. The intrinsic…
A:
Q: A researcher examined a sample of rainbow trouttaken from the Spokane River in Washington…
A:
Q: The Obama Administration instituted an economic recovery program in 2009 to arrest the recent…
A: The given logistic exponential function is N(t) = 10.003 / 1+ 0.0003e0.8t and 0 is equals to…
Q: n this exercise, we consider data from the Statistical Abstract of the United States on the fraction…
A: The data show that the fraction of women who reached their fifth anniversary was 0.928. After that,…
Q: At time t = 0, a bacterial culture weighs 4 grams. Three hours later, the culture weighs 5 grams.…
A:
Q: Given that the population of the US was 151 million, 216 million, and 281 million in 1950, 1975, and…
A:
Q: logistic growth function P(x)=90/ 1+271 e^−0.122x models the percentage, P(x), of Americans who…
A: Given the query is to find the percentage of 68 year old who has heart disease.
Q: The table lists the Consumer Price Index for all U.S. urban consumers (CPI-U) with 1982–1984 = 100…
A: Enter the given table values in excel sheet and get the required function using trend lines option…
Q: The amount of particulate matter in the air of a certain region was increasing exponentially with…
A: Here first we calculate relations in a and b using the given conditions then we can find the…
Q: Another quantity has initial value of 400 and decays at a rate of 5.2% per hour. Give an exponential…
A: Let the function be fx=400ax ....(1) After 1 hour fx=400-400×5.2100 =400-20.8=379.2
Q: Español Suppose that the number of bacteria in a certain population increases according to a…
A:
Q: The sales of typewriters have declined considerably in recent years because of the advent of…
A:
Q: Waterton Lakes National Park of Canada, where the Great Plains dramatically meet the Rocky Mountains…
A:
Q: Expand ln 3√y3z2/x4 as a sum, difference and/ or the consent multiple of logarithms.
A:
Q: The number of women graduating from 4-yr colleges in a particular country grew from 1930, when…
A: Let N(t)=Cekt...........Equation (A) Given- In year 1930, 48,829 women earned a bachelor's degree…
Q: The logistic growth function P(x)=901+271e−0.122x models the percentage, P(x), of Americans who…
A: The logistic growth function, Px=901+271e-0.122x models the percentage, P(x) of Americans who are x…
Q: the beginning of the COVID-19 pandemic, the number of new cases was growing exponentially. There…
A: Given query is to find the exponential Moda for COVID cases.
Q: For this prediction model, what is the probability of reaching the target from a distance of 49…
A:
Q: W (kg) A (m2) 77 2,15 87 2,30 2,26 70 75 80 82 84 90 2,10 2,12 2,20 2,22 2,23
A: If a non-linear model has to fit the given data, then we transform it to a linear model. Let be the…
Q: Two companies, Ataron and Endothon, produce carbon fibers. For both companies, the price to produce…
A: topic - graph and exponential function
Q: the logistic equation.
A: Ler Assume there is a certain population of fish in a pond whose growth is described by the logistic…
Q: How is the slope coefficient interpreted in a log-linear model, where thedependent variable is (i)…
A: The slope coefficient interpreted in a log-linear model of the dependent variable is given below as,…
Q: Español The mass of a radioactive substance follows a continuous exponential decay model, with a…
A:
Q: There is a well-studied panda population in Wuyipeng. In 1989 there were 35 pandas and the…
A: See the handwritten solution
Q: A rumor is spreading on an island with a population of 50,000 individuals. When the rumor starts to…
A:
Q: Solve for when the population increases the fastest in the threshold logistic equation : 1000 P'(t)…
A:
Q: The relative growth rate of world population has been decreasing steadily in recent years. On the…
A: Given
Q: What are the blanks?
A: Given that in 1995, there were 56.61 thousand performances in the United States by nonprofit…
Q: If you were asked to find an exponential model y= A6 that passes through the two points (3,6.2) and…
A:
Q: A population grows according to the logistic model. The r value is 0.022, and the environmental…
A: The general equation of the logistic model is as follows. N=K1+be-rt K is the carrying capacity r is…
Q: In a city of half a million, there are initially 400 cases of a particularly virulent strain of flu.…
A: Initially there are 400 cases of a particularly virulent strain of flu. infections increases 40%…
Q: Due to the rising temperatures in a bay ecosystem, the population mass of a certain species of…
A: We have given x(0)=600 tonsx(11)=2,000 tons population increase at…
Q: A linguist studying the spread of new words and slang observed that the number of daily occurrences…
A:


Trending now
This is a popular solution!

Step by step
Solved in 2 steps

- An investigator modeled the log-odds of getting stomach cancer as a function of number of servings of vegetables per week and the number of servings of red mean per week using logistic regression. The odds that a person gets stomach cancer if they have 4 servings of red meat a week are 1.2 times the odds of cancer for someone who has 3 servings of red meat a week. suppose in the example, where the regression coefficient for servings of vegetables is -0.105, we have also obtained from the SAS output a Standard Error from the output of 0.097. Since our estimates are maximum likelihood estimates, we can assume that they follow a normal distribution. As such we can create confidence intervals for the regression coefficients using standard practices for estimates that have normal sampling distributions. Calculate a 95% confidence interval for the ODDS RATIO given above (odds ratio representing the change in odds of stomach cancer for a one-serving increase in vegetables. Give the…An investigator modeled the log-odds of getting stomach cancer as a function of number of servings of vegetables per week and the number of servings of red mean per week using logistic regression. The odds that a person gets stomach cancer if they have 4 servings of red meat a week are 1.2 times the odds of cancer for someone who has 3 servings of red meat a week. Suppose the fitted regression model is given as log-odds = -6 + 0.182 M – 0.105 V, where M = #servings of red meat per week and V = #servings of vegetables per week. What is the odds ratio representing the change in odds for an increase in one serving of vegetables? Give the answer to three decimal places.How is the slope coefficient interpreted in a log-linear model, where thedependent variable is (i) in logarithms but the independent variable is not, (ii)in a linear-log model, (iii) in a log-log model?
- In a city of half a million, there are initially 400 cases of a particularly virulent strain of flu. The Centers for Disease Control and Prevention in Atlanta claims that the cumulative number of infections of this flu strain will increase by 40% per week if there are no limiting factors. Make a logistic model of the potential cumulative number of cases of flu as a function of weeks from initial outbreak, and determine how long it will be before 100,000 people are infected. (Round your answer to two decimal places.)In a city of half a million, there are initially 800 cases of a particularly virulent strain of the flu. The Centers for Disease Control and Prevention in Atlanta claims that the cumulative number of infections of this flu strain will increase by 40% per week if there are no limiting factors. Make a logistice model of the potential cumulative number of cases of flu as a function of weeks from initial outbreak, and determine how long it will be before 100,000 people are infected. (Round your answer to two decimal places.)In a city of half a million, there are initially 800 cases of a particularly virulent strain of flu. The Centers for Disease Control and Prevention in Atlanta claims that the cumulative number of infections of this flu strain will increase by 40% per week if there are no limiting factors. Make a logistic model of the potential cumulative number of cases of flu as a function of weeks from initial outbreak, and determine how long it will be before 100,000 people are infected. (Round your answer to two decimal places.) ? weeks
- What is the logistic equation? Why is it useful?**Complete the table** 1) A sample of data is collected (from 1999 and 2000) concerning the compensation of the executives (compensation is measured in 1000’s of $’s) of a number of public companies along with other firm-specific data. The dependent variable is total compensation, CEOANN is a dummy variable =1 for an individual who is a CEO and =0 for individuals who are not CEO’s, EMPL is total employees, MKTVAL is the natural logarithm of the market value of the firm, EPSIN is earnings per share, YEAR is a dummy variable = 1 for the year 2000 and =0 for year 1999, and ASSETS is the natural logarithm of the total assets of the company. a) Complete the table belowAn investigator modeled the log-odds of getting stomach cancer as a function of number of servings of vegetables per week and the number of servings of red mean per week using logistic regression. The odds that a person gets stomach cancer if they have 4 servings of red meat a week are 1.2 times the odds of cancer for someone who has 3 servings of red meat a week. What is the odds ratio for stomach cancer for someone who has 5 servings as opposed to someone who has 3 servings? Enter your answer to 3 digits beyond the decimal point.
- Who is the inventor of the logistic function? 1.Ludwig Ogistic 2.The iranian physicist Piver Verfraco 3.The Belgian mathematician Pierre François Verhulst.Is the logistic equation separable?What happened to the standard error of educ after adding KWW to the model? Discuss. Do you agree or disagree with the following statement? “If the log of the dependent variable appears in the regression, changing the unit of measurement of any independent variable affects both the slope and intercept coefficients”. Discuss by providing the resource.
