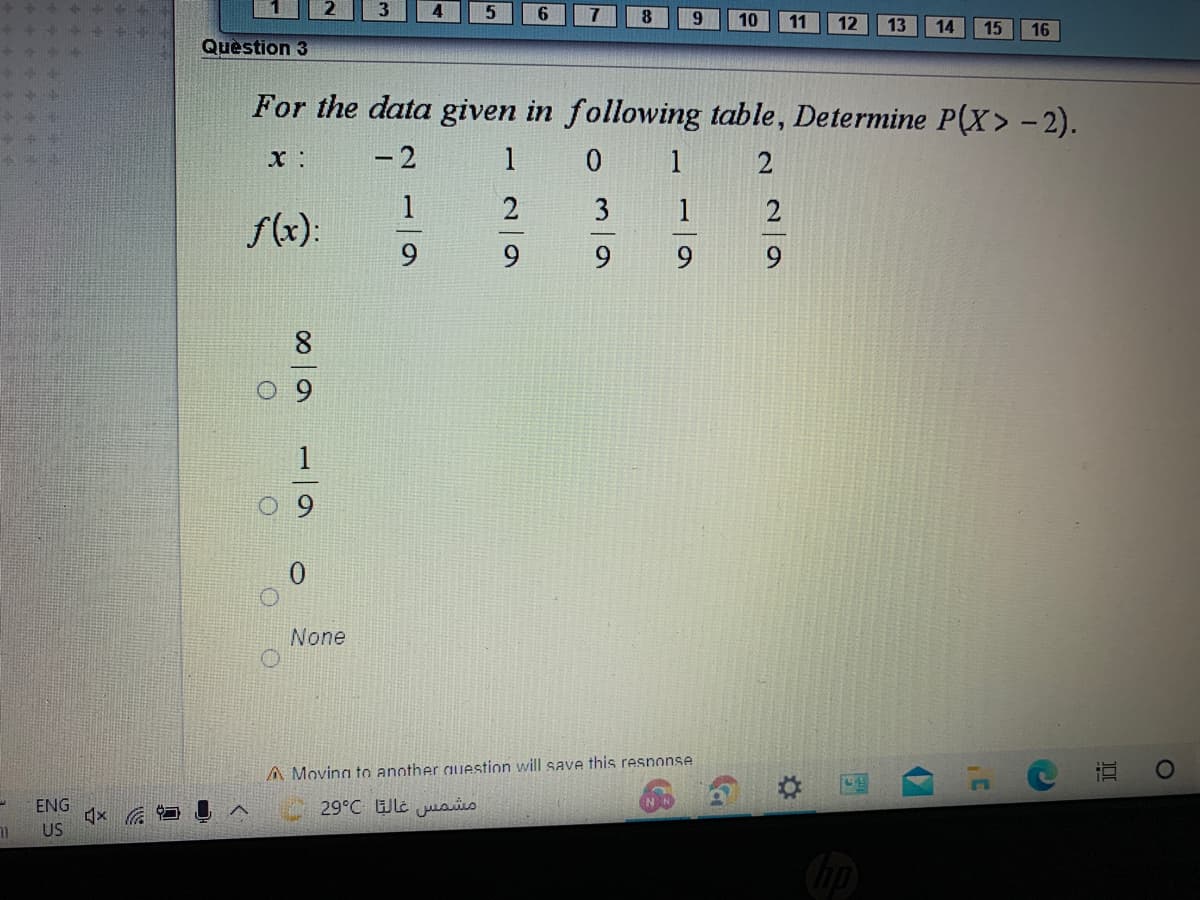
For the data given in following table, Determine P(X> - 2). x : - 2 10 1 1 3 1 f(x): - 1 None 00 | a


Q: Using the function f (x) = x3 + 0,4x2 + x, the following data set was created.Using this data set,…
A:
Q: Use the table below to determine a best estimate for f'(9). 1 9. 13 17 f(x) 12 14 18 36 50
A: The derivative at x = 9 is equal to the slope at x = 9. To estimate the slope at x = 9 first find…
Q: For a given table 3. 10 S(x) 4. 7. 11 15 Using linear interpolation formula, find f (5).
A:
Q: For the following set of scores, find the value of eath expression: a. EX? b. (EX) c. 2(X-1) d.…
A:
Q: Answer #28 - #34 using this data set: f 7 1 6 4 5 3 4 1 3 1 2 1 3 31. What is the mean of X? (SHOW…
A: Given below
Q: Consider the data in the table Approximate f'(0.9) Xi 0.4 0.6 0.8 1.2 f(x) 1.4 1.8 2 2.4 0.8 O…
A: Introduction: Finding new data points within the bounds of a discrete collection of existing data…
Q: Add the plot of f against x for the following data to the graph of y = −1.1x + 8.1. x 1 2 3 4 5 y 7…
A: Given: function is y = −1.1x + 8.1. Data table is x 1 2 3 4 5 f(x) 7 6 5 4 3
Q: For the data in the following table, what is the value of ΣX? X f 4 2 3…
A: Given data is x f 4 2 3 1 2 0 1 1
Q: Given the following data, find the value of D3
A:
Q: Find the z-score corresponding to a score of X = 30 for each of the following: µ =50 and σ = 20 µ…
A: The formula for finding the z score is shown below:
Q: For the following data, find the divided differenceS[x,,x,]. Here y, - f(x.), i= 0,1,2,3. 6. 13 20…
A: we need to find the divided difference f[x1, x2] we have given x1=6, x2=13, f(x1)=25, f(x2)=47
Q: For a given table 1 3 6. 10 f (x) 4 7 11 15 Using linear interpolation formula, find f (5).
A: The linear interpolation formula is given by y=y1+(x-x1)y2-y1x2-x1 where, x1,y1 and (x2,y2) be two…
Q: For the following distribution of quiz scores, if a score of X = 3 or higher is needed for a passing…
A: We are given the below data:X f5 64…
Q: For the following data (0, 22), (15, 24), (18, 37), (22, 25), (24, 123) what three data points of x…
A:
Q: For each p-value given, indicate the level(s) at which it would be significant 10% 5% 1% p-value =…
A:
Q: For the following data, test the hypothesis that a relationship exists between X and Y.rxy = .30,…
A: Given, Correlation = r = 0.30 Sample size = n = 61 The null and alternative hypotheses are, H0 : ρ =…
Q: Given the following table, give the best estimate for f'(9) - f(9) 3 12 15 f(x) 39 42 53 64 27 4 The…
A:
Q: For the following data, find V²y, . Here y, = f(x,) and x, = x, +ih, i =0,1, 2,3... 13 5 7 12 20 25…
A:
Q: Compute f(x) for the data below: (0, 1), (1.25,3) and (3.25,7)
A:
Q: Complete the following statements: 1. In general, _________% of the values in a data set lie at or…
A: Solution : Definition of percentile - The percentile indicates the values below which given…
Q: From the data given below, find the number of items: r = 0.5 Exy = 120 Ex2 = 90 Qy = 8 (where x and…
A:
Q: Given the following table, give the best estimate for f'(3) 6. 12 15 f(x) 30 41 51 60 28 The…
A: Function values are given in the table, we have to find the estimate for f'(3)
Q: A set of n = 10 pairs of scores has ΣX = 20, ΣY = 30, and ΣXY = 74. What is the value of SP for…
A: We have given that, ΣX = 20, ΣY = 30, ΣXY = 74, n= 10 Then, We will find the value of SP=?
Q: using the data X P (X) 0 0.12 1 0.18 2 0.30 3 0.15…
A:
Q: The two data sets are dependent. Findd to the nearest tenth. X| 11.2 11.3 11.6 12.9 10.6 5) Y 11.1…
A: Given Data X Y D = X-Y 11.2 11.1 0.1 11.3 12.6 -1.3 11.6 12.9 -1.3…
Q: how would i find the point estimate for q?
A: The point estimate for p is,
Q: Determine the value of y for x = 2 , given the following data:
A:
Q: In general, __________% of the values in a data set lie at or below the median. ___________% of the…
A: topic - statements
Q: For the following set of scores, find the value of each expression: _______ X _______ 7…
A: Solution: Given data X = 7 , 3 ,9 ,5 ,4 To find: ∑X ∑(X)² ∑X² ∑X + 2 ∑(X - 2)
Q: For the scores in the following table, what is the value of ΣX2? X f 4 1 3 2 2 1…
A:
Q: Step 3: Find the p-value of the point estimate. P(r sv -6432 P(E Sv svV -2.78601 =-.6432
A: We have to find P(t < -2.78601) in the last part.
Q: For the data in the following table, what is the value of ΣX? X f 4 2 3 2 2 4 1 2
A: The given table is a frequency table.
Q: 3. Given the following p.d.f.: f(x) = 3e-3x, where x > 0, find the Median. Show all work and…
A: Given, p.d.f is fx=3e-3x, x>0 Note: ∫0mfxdx=12 m is the median of x.
Q: HW.1 X y 58 Find y. (10) for the following data in the below table. 6 9 14 17 10
A: We will use Lagrange's Interpolating polynomial to find y10.
Q: For the following data, N = _____. X f 4 2 3 3 2 1 1…
A: Given, N=?
Q: h. Compute for the range of the data set.
A: here use given data of applicants and their respective score
Q: Consider the following table where g (x), h(x), and m(x) are
A:
Q: Complete the following statements. a. In general, % of the values in a data set lie at or below the…
A: We have to answer questions based on the definition of percentile.
Q: For the following data, find Vy, . Here y, = f(x,) and x, =x, +ih, i = 0,1,2.3. 13 5 7 9 S(x) 5 8 12…
A: Make the Newton's backward table to obtain the values for ∇2yn .
Q: -From the following data find the marks in English. If the marks in Hindi is 50. Hindi (X) English…
A: It is given that For X, mean = 40, SD = 10 For Y, mean = 50, SD = 16 Correlation coefficient = 0.5
Q: From the data given below, find the number of items n. r= +0.5, Ery = 120, o, = 8, Ex = 90 where x…
A:
Q: From the data given below find the number of items (n) : r = 0.5, E xy = 120, oy= 8, E x = 90 %3D…
A:
Q: Approximate f(4) for the following set of data using cubic spline: [0, 1], [3, 2], [8, 3]
A:
Q: For the following questions, use either the statistics functions on your calculator or another…
A: It is widely used in statistics . It is an application of the measures of dispersion .
Q: Find the z-score for each of the following X values 32 34 36 75 100 60 44 20 25 23 80 76 55
A: The standard score or z score is computed by dividing the difference between observation and mean by…
Q: Q5\For the following data sets, find the range. a) The following numbers represent the time in…
A:
Q: Establish the relationship between x & y approximately by using an interpolation formula from the…
A:
Q: a) Consider the following data: x12 3 4 y 345 6 Briefly explain why it can be seen from this data…
A: We need to find a constant for which x = ay If there is not unique a then these are not…
Q: The first divided difference fx0, x1] for the following data is xo = 1, x1 = 10, f [æo] = 7, f[x1] =…
A:
Q: For The following data, the best fit line is: X 2 Y 12 10 12 3 r will be - 0.987 r will be positive…
A: Explanation of the answer is as follows

Step by step
Solved in 2 steps with 2 images

- 12/20 Compute the linear correlation coefficient between the weight of a car and its miles per gallon. R =_. Round to three decimal places as needed.A sample of n= 64 scores has a mean of M= 68. Assuming that the population mean is u=60, find the z-score for this sample: If it was obtained from a population with o= 16 Z=To increase egg production, a farmer decided to increase the number of times the lights in his henhouse were on. Ten hens were randomly selected, and the number of eggs each produced was recorded. After one week of lengthened light time, the same hens were monitored again. The data is given here. At α = 0.05, can it be concluded that the increased light time increased egg production? Hen 1 2 3 4 5 6 7 8 9 10 Before 4 3 8 7 6 4 9 7 6 5 After 6 5 9 7 4 5 10 6 9 6
- T/F: An analysis was performed on data relating the number of weeks of experience in a job involving the wiring of electronic components and the number of components that were rejected during the past week for 12 randomly selected workers. The analysis is as follows: There is no apparent relationship between experience and rejects produced. True FalseA sample of n=25 scores has a mean of M=68. Find the z-score for this sample: if it was obtained from a population with u=60 and 0=10A researcher wants to examine the relationship between time spend on social media (variable X) and loneliness (variable Y) in young adults. A randomly sample of n = 52 young adults was asked how much time in average they spend on social media each day and how lonely day feel on a typical day. The partial computations of collected data produced the following results: SP = -14 MX = 10 SSx = 36 MY = 16 SSY = 49 A. Based on these results, is there a significant correlation between time spend on social media and loneliness among young adults? Use a Pearson correlation test with p < .05, 2-tails to answer this research question. Follow the steps of hypothesis testing and insert your answers below. In your calculations,round all numbers to two decimal places to avoid rounding errors. ANSWER H0: H1: Computed Pearson r = df for decision about H0: Critical r-value used for decision about H0: Decision about H0 (i.e., reject or fail to…
- Marine biologists have noticed that the color of the outermost growth band on a clam tends to be related to the time of year in which the clam dies. A biologist conducted a small investigation of whether this is true for the species Protothaca staminea. She collected a sample of 50 clam shells in February and 27 clam shells in March. 15 of the shells from February had a dark color on the outermost growth band, whereas 8 of the shells from March had a dark color on the outermost growth band. Carry out a hypothesis test to see if there is a difference in the proportion of shells with a dark outermost growth band between the two months. The point estimate for the true difference in proportion of dark growth bands between February and March is:Marine biologists have noticed that the color of the outermost growth band on a clam tends to be related to the time of year in which the clam dies. A biologist conducted a small investigation of whether this is true for the species Protothaca staminea. She collected a sample of 50 clam shells in February and 27 clam shells in March. 15 of the shells from February had a dark color on the outermost growth band, whereas 8 of the shells from March had a dark color on the outermost growth band. Carry out a hypothesis test to see if there is a difference in the proportion of shells with a dark outermost growth band between the two months. Let ? = 0.01. A) The point estimate for the true difference in proportion of dark growth bands between February and March is:Marine biologists have noticed that the color of the outermost growth band on a clam tends to be related to the time of year in which the clam dies. A biologist conducted a small investigation of whether this is true for the species Protothaca staminea. She collected a sample of 50 clam shells in February and 27 clam shells in March. 15 of the shells from February had a dark color on the outermost growth band, whereas 8 of the shells from March had a dark color on the outermost growth band. Carry out a hypothesis test to see if there is a difference in the proportion of shells with a dark outermost growth band between the two months. Let ? = 0.01.Note: Do all calculations as February - March A) The point estimate for the true difference in proportion of dark growth bands between February and March is: I need help and webassign rejected the 0.0037 as the answer. I'm so lost. I emailed my professor and he hasn't gotten back to me. Please help. Thank you.
- 4. For a sample of 12 observations, a businessman wants to regress the price (in dollar) of the laptop (Y) on the processor's speed (X). The summary results of the observations are given below. Σx = 19.8 , Σy = 24798, Σxy = 431882 Σx^2 = 3388, Σγ^2 = 57365692 (c) Find the predicted price of the laptop (y) for the processor speed x-1.9. (d) Compute the coefficient of determination and comment.A sample of n=25 scores has a mean of M=68. Find the z-scores for this sample: if it was obtained from a population with u=60 and o=402) Let G and H be two independent unbiased estimators of θ. Assume that the variance of G is two times the variance of H. Find the constants a and b so that aG + bH is an unbiased estimator with the smallest possible variance for such a linear combination.