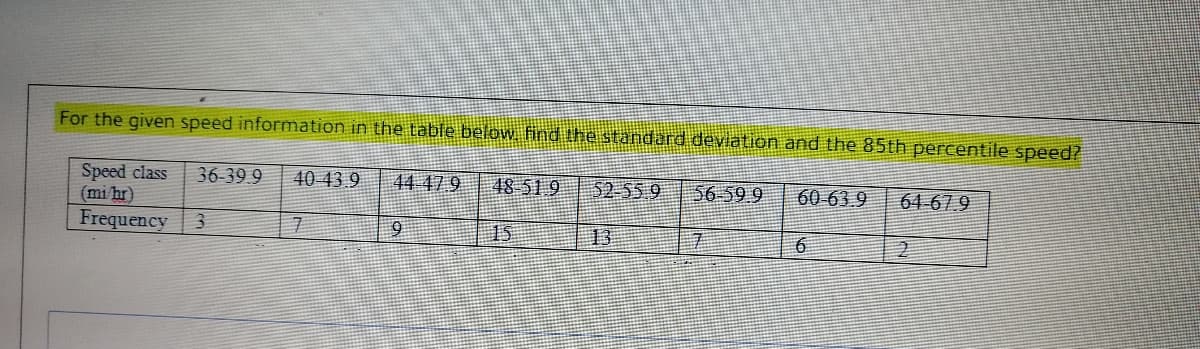
For the given speed information in the table below find the standard deviation and the 85th percentile speed? Speed class (mi hr) Frequency 3 36-399 40 43 9 44 47 9 48 519 52 55 9 56-59 9 60 63.9 64-67 9 15 13


Q: 3. Compute the Time Mean Speed and Space Mean Speed Vehicle Time (s) Speed (km/hr) A 15 100 25 150…
A:
Q: What is the probability that the headway between successive vehicles more than 20 seconds? 18.20%…
A: volume of vehicles = 320 vehicles/ hr probability that the headway between successive vehicles…
Q: An object moving along a horizontal coordinate line has directed distance s(t) = t3 – 6t? + 9t +11…
A: S(t)= t3-6t2+9t+11 On differentiation of this expression we get ds/dt which gives the value of…
Q: In three trials of walking along a 90m course on fairly level ground, a pacer counted 52.5, 51, 51.5…
A:
Q: Q1/ Find speed percentages (by drawing) depending on the data shown in the table below. (Hint:…
A: speed Km/hr frequency cumulative frequency % cumulative frequency 19 2 2…
Q: An angle is observed repeatedly using the same equipment and procedures. Calculate (a) the angle’s…
A:
Q: The following speed data was collected Using a radar gun on an arterial street. Speed Group (mph)…
A: Calculate time mean speed:
Q: A surveyor counted 50, 52, 53, 51, 53, and 51 paces while walking along a 45-m course on a concrete…
A:
Q: There are 5 vehicles passing a certain point on the observation road in a period of 20 seconds. It…
A:
Q: (b) An engineer wishing to determine whether there is a statistically significant difference between…
A:
Q: 3. A moving vehicle come up to a danger and traveled a distance of 48 meters during the perception…
A: Stopping Sight Distance (SSD) is given by : SSD=0.278 V Tr + V2254(f±s%) Given SSD = 48m Tr = 2.67…
Q: Homework In the entrance of car parking, the vehicle arrival in each counting period of 100 sec. is…
A:
Q: Given the data below, plot the cumulative mass curve and the 30 minute hyetograph Time (min)…
A: Given data,
Q: A snowboarder starts from rest at the top of a double black diamond hill. As she rides down the…
A: DISPLACEMENT means that an object is displaced or moved from original position. GIVEN EXPRESSION…
Q: The dimensions of a closed rectangular box are measured as 21 cm, 17 cm and 11 cm, respectively with…
A: Option A is the correct option 77.5
Q: Using the ordinates of a 12-h unit hydrograph given below, compute the ordinates of the 6-h unit…
A: To convert 12 hr unit hydrograph to 6 hr unit hydrograph multiply the ordinate of 12 hr unit…
Q: 3. Compute the Time Mean Speed and Space Mean Speed Vehicle Time (s) Speed (km/hr) A 15 100 25 150…
A:
Q: The observed interior angles of a triangle are A =35°14’37”, B = 96°30’09”, C= 48°15’05”. Determine…
A: To find discrepancy
Q: The parking survey data collected from a parking lot by license plate method is as shown in the…
A: Given:- The parking survey data collected using the license plate method is given Bay 0-15 15-30…
Q: Question (1) Traffic Volume on a four lane freeway (two lanes in each direction) were counted…
A: a) The peak hour factor for each direction and each lane. Finding peak hour factor for lane 1 From…
Q: 3. Compute the Time Mean Speed and Space Mean Speed Vehicle Time (s) Speed (km/hr) 15 100 25 150 45…
A:
Q: Suppose the heights H of 800 students are normally distributed with mean 66 inches and standard…
A:
Q: For the given speed information in the table below, find the standard deviation ?and the 85th…
A: For the traffic speed data given it is required t find the standard deviation of speed and then the…
Q: The posted speed along Sumulong Highway is 60 km/hr. The Table below shows the summary of 64 samples…
A:
Q: The Table below shows the data collected on a urban highway in Accra during a speed study. Develop…
A: Given; Speed range (mi/h) Class, ui (mid value) frequency (No. of observations in class),fi fi×ui…
Q: Problem 2: The following data are taken from 5 vehicles observed from photographs taken 3 seconds…
A:
Q: For the Figure Shown Below, Calculate the Station of the BC and EC. PI 14+87.33 A= 11°21'35" If A=…
A: The given figure is shown below:
Q: 21. From the given data of 4 vehicles passing through a 1.2 km segment of highway. Compute the time…
A: Three problems have been asked. Here answer for the first one is provided.
Q: Given the following end-sections of a 15-m wide road whose side slope is 1.5:1. 5 8 4 6 4 + 580 4 +…
A:
Q: In the entrance of car parking, the vehicle arrival in each Counting period of 100 sec. is shown in…
A: The given data: Vehicle per 100 sec Frequency 0 60 1 28 2 16 3 8 4…
Q: The inflow and outflow hydrograph of a river channel is shown in Table 4. Regression analysis of the…
A: The regression analysis is given as,
Q: For the given speed information below, the 85th percentile speed is approximately ..... (mi/hr).…
A: Given Data:
Q: Find the mean, median, mode, the range, mean absolute deviation and standard deviation for the…
A: Mean: It is the average of all the given numbers. It is calculated by dividing the summation of the…
Q: A man tried to measure the length of perimeter fence of a construction site by pacing around the…
A: solution Given To calculate the length of the perimeter number of paces given as 494,485,498,489…
Q: Find the exact simple interest on P 10,000.00 for the period from January 2016 to November 23 2018,…
A:
Q: You are working at a radar station for the Coast Guard. While everyone else is out to lunch, you…
A: Use Cosine Rule To Find out the Distance of Sinking Ship from Various Ships And then time taken by…
Q: Provide the following 1. frequency distribution table 2. frequency histogram 3. frequency…
A: Median speed : The speed at which the speed allocation is divided into two equal portions is called…
Q: For the given speed information below: Speed class 28-31.9 32-35.9 36-39.9 40-43.9 44-47.9 48-51.9…
A: Given:- The speed information is given below Speed class (mi/hr) Frequency 28-31.9 1 32-35.9…
Q: check whether The arrival distribution of vehicle can be assumed random or not vehicle per 100 sec…
A: By plotting the given data we can draw a graph ( manually or using xl )
Q: parking
A: Givenμ=12minσ=2.5minX=15min
Q: The pace factor of a random man was recorded to be 0.76 meters per step. If there is 2.7% margin of…
A: We will calculate total distance and find probable error by 2.7 %.
Q: From the following data of a freeway surveillance, there are 7 vehicles counted for a length of 300…
A: Traffic Flow: The study of the movement of vehicles and their interaction with one another between…
Q: The results of a speed study is given in the form of a frequency distribution table. Find the time…
A:
Q: For spot speed study analysis find the estimate standard deviation: 100 90 80 70 60 50 30 20 10 35…
A: Median speed Mid point speed 36-37 ; x+y2=36+372=732=36.5 frequency of 36-37 ; x+y2=8+92=172=8.5…
Q: A distance AB is observed repeatedly using the same equipment and procedures, and the results in…
A:
Q: Sir Alfonse sent out five students to measure a distance between two points marked on the ground…
A: To find most probable value of the distance measured.
Q: The posted speed along Sumulong Highway is 60 km/hr. The Table below shows the summary of 64 samples…
A: 1) Mean = Ratio of sum of all the speech to the number of vehicles Observed.
Q: 3. Compute the Time Mean Speed and Space Mean Speed Vehicle Time (s) Speed (km/hr) A 15 100 B 25 150…
A:
Q: Vehicle Travel Time ( s) 1 156 2 144 3 144 4 168 5 126 6. 132
A:

Step by step
Solved in 2 steps


- For the distance (ft) observations given below, find the most probable value and standard deviation. 100.01, 100.05, 99.95, 99.98, 100.03, and 99.97A distance of 300 meters was measured with a tape measure on several stages and with a difference in the angle of inclination as shown in the following table, and after calculating the amount of correction due to the inclination, calculate the real distance if the inclination was Tilt 2 ° 20 ' 4 ° 12 ' 1 ° 06 ' The distance is 100 150 50A distance AB is observed repeatedly using the same equipment and procedures, and the results, in meters, are listed below: 69.401, 69.400, 69.402, 69.396, 69.401, 69.401, 69.396, and 69.404. 1. Determine the range within which the observations should fall 90% of the time. Express your answers in meters to six significant figures separated by a comma. 2. What percentage of values fall within this range? 3. Determine the range within which the observations should fall 95% of the time. Express your answers in meters to six significant figures separated by a comma. 4. What percentage of values fall within this range?
- The observed interior angles of a triangle are A =35°14’37”, B = 96°30’09”, C= 48°15’05”. Determine the discrepancy for the given observation and the most probable value of each angle. a. +09" b. +27'09" c. +27.09" d. +2'09"A distance AB is observed repeatedly using the same equipment and procedures, and the results in meters are the following; 101.21 100.50 100.85 100.36 102.10 101.25 101.38 101.64 102.05 101.30 What is the standard deviation?A surveyor counted 50, 52, 53, 51, 53, and 51 paces in walking along a 45 – m course laid out on a concrete pavement. He then took 768, 771, 772, 770, 769, and 770 paces in walking an unknown distance CD. Calculate his pace factor and the length of the line CD. Deternmine the percent error if the line CD has an actual length of 670m
- Sir Alfonse sent out five students to measure a distance between two points marked on the ground using their pace factor. The students came up with the following five different values: 50.13, 47.90, 51.04, 50.47, and 48.22 meters. Assuming these values are equally reliable and that variations result from accidental errors, determine the most probable value of the distance measured.A) What is the time-mean speed? Present your answer in units of [feet/sec] to two decimal places? B) What is the spacing between the vehicles in Image 1? Present your answer to the nearest foot. C) I calculate that the (average) density obtained from these images is 18.2 [veh/mi]. Assume that this value is correct, even if I made a mistake.If a loop detector sensing these vehicles was occupied 5% of the time, what is the average length of the vehicles? Present your answer in units of feet to one decimal place.An angle is observed repeatedly using the same equipment and procedures. Calculate (a) the angle's most probable value, (b) the standard deviation, and (c) the standard deviation of the mean. 23°30'00", 23°29 40", 23°30ʻ15", 23°29'50"
- Figure 3 shows a square plate is constrained within the slots at A and B. When θ = 25°. Point A is moving at va = 12m/s. Determine the velocity point D at this instant and the trajectory of the instantaneous center of zero velocity(IC) when the square plate moves from θ = 25° until θ = 0°. When θ = 0°, determine the velocity of point B and point C if the va = 20m/s. Another case, when θ = 25° and the velocity of point A is increase to 14m/s, does the trajectory of IC change? Justify your answerProject a two-lane-two-way road that passes through mostly wavy terrain according to your data and find out at what service level the road will work. Peak hour traffic volume= 800 Peak hour factor= 0.91 Passing ban cut rate (%)= 40 Distribution according to directions (%)= 60/40 Hard shoulder width (meters)= 2 Strip width (meters)= 2.70 Truck Ratio= %9 Bus Ratio= %10how can errors occur when trying to measure the average speed of a an actual car passing by with a meter tape