Q: Question 16 What are the intersections of the graph of (x+2) +y 25 and 4x+3y = 17? 0 (2,0) (S८ टो ०.…
A: Given problem:- Find the intersections of the graph of (x + 2)2 + y2 =25 and 4x + 3y = 17?
Q: Question 3: Match each equation with a graph above -2 -x is a.green b.blue c.red d.orange 2 -x is…
A: To match the equation with graph
Q: Question 2: If all the graphs above have equations with form y=ab^x, which graph has the largest…
A: Given data: The given expression for the graph is: y=abx. When the value of a is kept…
Q: Question 4: Find the equations of the graphs indicated below: 4.1 4.2 (3)
A: Since you have posted multiple question i can do first question as per our company guidelines please…
Q: Question 4: Write a possible equation for the graph below. 2. 3 -1 2.
A: center of this ellipse is (3,-2)length of major axis is 2a=10a=5length of minor axis is 2b=4b=2
Q: Problem 5 A tank contains 500 liters of water and no chlorine, water containiną 10 mg/eliter of…
A: Please check further steps for solution.
Q: In Problem 115, you may use a graphing utility, but it is not required. 115. (a) Graph y = Vr,y = x,…
A:
Q: Question# 6. Chess Chess is a board game, where the board is made up of 64 squares arranged in an…
A: Below image can be consider as a schematic of the chess board. There are two directions in which the…
Q: Please answer these questions below. A-B question (A) Which of these two car rental companies would…
A: (A)(1) Complete the table calculating only the per day charge.
Q: Part B: Researchers gave one group of people pills containing Vitamin C to take every day and gave…
A: We have to answer question related to the graph.
Q: Use the graph to answer the following questions.
A:
Q: Question 2 Which graph has the largest value for b ? a.green b.orange c.black d.red e.blue Which…
A: The graph of the equations of the form y=ab^x
Q: Questions: #1: What does this scatter plot look like? # 2: Describe what the graph is doing.
A: For the given data, we need to draw a scattered plot and describe it.
Q: Question 7 Show that the two drawings represent the same graph by labelling the vertices and edges…
A:
Q: Question 7 67 ple 4. -14 -13 -12 -11 -10 -6 -4 -2 -2 Find an equation for the graph above.
A: The general equation of a trigonometric function is given by the equation; y=A sin(B(t-D))+Cory=A…
Q: NAME AGE (years old) HEIGHT (m) YANG JUNGWON 42 1.65 LEE HEESEUNG 42 1.53 PARK JONGSEONG 20 1.68|…
A: Given Data : X = AGE Y = HEIGHT 42 1.65 42 1.53 20 1.68 17 1.6 15 1.55 13 1.55 13…
Q: Problem 1: The graph below represents the distance-time relationship from Kevin and Carrie as they…
A:
Q: Problem 1 For two weeks, the highest temperature each day was recorded in four different cities.…
A: GIven: l is the line for Lubbock m is for Memphis n is for New orleans and p is for phoenix.
Q: Question 4 Cities build bike trails and playgrounds as recreational activities. The graph shows the…
A:
Q: QUESTION 4 Find the value of x that corresponds to y = 2 in the graph of the equation y + y – x + 1…
A:
Q: Question 7 10 -8 -6 -4 -2 8 10 -2- -4 -6 -8 -10 Write an equation for the graph, where y depends on…
A:
Q: 2 What kind of graph this Per 1,000 People 700 600 s0 400 300 200 100 1960 1965 1970 1975 1980 1985…
A: A double line graph is a line graph with two lines
Q: y = (x - 4)- 3 2. S1810
A:
Q: Question 14 (5 points) The graph below represents the balance of Sherman's checking account. Based…
A: Account balance reaches when there is no money in the account. This happens at x=7.
Q: Question 1 The graph of
A:
Q: 4. (2, 2) Figure 1 Graph for Problem 4 5. Figure 2 Graph for Problem 5
A: Lapalce transferom
Q: QUESTION 5 Determine whether the graph is symmetric with respect to the x-axis, the y-axis, and the…
A:
Q: This graph is from a study evaluating an opioid drug and gender on pain levels. Which of the…
A:
Q: Determine the mistakes in the given graphs below. Fatal Occupational Injuries U.S. Domestic…
A: Graphs essentially provide the visual and summarized representations the variable(s) under study.…
Q: Question 11 The graph below shows y = b(x). 10 9. 8 4 3 -10-9 -8-7 -6 -5 -4-3 -2 -1, i2 3 4 5 6 7 8…
A: From the given graph, y=f(x) is the function because each element of the domain is assigned to…
Q: Question 4 Item A Item B Item D Item C The homeowners association (HOA) surveyed all the families in…
A: It is an important part of statistics. It is widely used.
Q: Problem 1: The fundraising director of a high school has compiled data about the school's car…
A: Here graph is given ( x-axis : car washed, y-axis : profit) We have to answer for mentioned…
Q: QUESTION 4 a) Below is a graph showing the shaded region A. 5. 3 2- A 3 4 6 x 3 -2 -10 -1 -6 -5 2 -3…
A:
Q: Question 7: Write the equation of the line shown on the graph. * 10 8 6 4 10 -8 6 -4 2 0 2 4 6 8 10…
A: In this problem, we will use the standered result of line equation... and find the line equation…
Q: This graph shows how a sapling's height depends on its age. Height of a sapling 100 90 80 70 60 50…
A:
Q: What is the reduncy number of the graph in Problem 34? A) 0 В) 3 C) 2 D) 1
A: Given graph is the above graph is connected graph with number of edges is 5. let number of edges of…
Q: Question 1 Kat is steadly increasing her speed for the first part of the race. She then keeps a…
A: We can find the answer as below
Q: QUESTION 3 List the ordered pair for the following graph. a d e…
A:
Q: Is the graph shown below planar? Explain your answer. Discreet mathematics graph problem
A: There is no such introduction for the solution.I have explained it within the solution.Please go…
Q: The graph from question five is reproduced below. Click on the location (coordinates) where the drug…
A: Let us assume a function f(x). For the function f(x), the rate of change of function is given by the…
Q: Make a graph of microbial growth from each of the data available in the table. Please no reject only…
A: Total Plate count (TPC) H-5 S. No Sample Code 10x10-0 10x10-1 10x10-2 10x10-3 Colony/g 1…
Q: QUESTION 3: Find the x and y intercepts for the following graphs b. (4, 6) YA 6- 6- 15 4- 4 3- 3- 2-…
A:
Q: Question 2 of 10 Tristen is creating a graphic design image. The graph shows one layer of his…
A: Relative maximum is the highest point of the graph . It is at x= 8
Q: Question 3 4 5 State both the domain of the graph given below and whether or not it is a function.…
A: Domain:{-10-3,9,10} Function: No
Q: Problem 1: The graph below represents the distance-time relationship from Kevin and Carrie as they…
A: a) From the graph given in the question, the distance travelled from start of time to the end time…
Q: The number of burglaries in a city is depicted in two different graphs below. Burglary Counts Graph…
A:
Q: Problem No. 6 For the next three exercises, use the data to construct a line graph. a. In a survey,…
A: A line graph a type of chart used in statistics to analyze the trend of data that changes over time…
Contingency Table
A contingency table can be defined as the visual representation of the relationship between two or more categorical variables that can be evaluated and registered. It is a categorical version of the scatterplot, which is used to investigate the linear relationship between two variables. A contingency table is indeed a type of frequency distribution table that displays two variables at the same time.
Binomial Distribution
Binomial is an algebraic expression of the sum or the difference of two terms. Before knowing about binomial distribution, we must know about the binomial theorem.
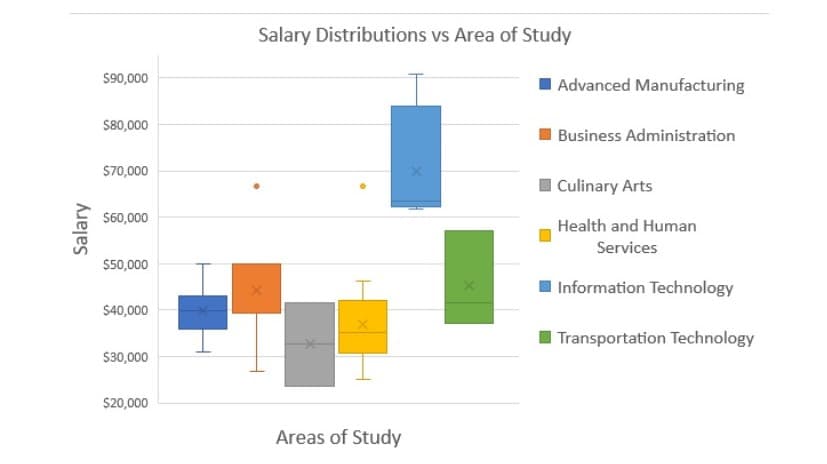
For the graph shown below, which Area of Study had all of its salaries between $52,000 and $30,000?
Trending now
This is a popular solution!
Step by step
Solved in 2 steps
- Assume a company’s activity-based costing system includes three activities. The following information is available with respect to those activities: Activity Cost Pool Estimated Overhead Cost Expected Activity Testing $ 150,000 100,000 testing minutes Setups $ 114,400 2,200 setup hours Molding $ 220,000 10,000 machine hours What is the activity rate for the Setups activity?Dixie Showtime Movie Theaters, Inc., owns and operates a chain of cinemas in several markets in the southern U.S. The owners would like to estimate weekly gross revenue as a function of advertising expenditures. Data for a sample of eight markets for a recent week follow. Market Weekly Gross Revenue($100s) Television Advertising($100s) Newspaper Advertising($100s) Mobile 102.5 5.1 1.6 Shreveport 52.7 3.2 3.0 Jackson 75.8 4.0 1.5 Birmingham 127.8 4.3 4.0 Little Rock 137.8 3.5 4.3 Biloxi 101.4 3.6 2.3 New Orleans 237.8 5.0 8.4 Baton Rouge 219.6 6.9 5.8 (a) Use the data to develop an estimated regression equation with the amount of television advertising as the independent variable. Let x represent the amount of television advertising. If required, round your answers to three decimal places. For subtractive or negative numbers use a minus sign even if there is a + sign before the blank. (Example: -300) = + x…Dixie Showtime Movie Theaters, Inc., owns and operates a chain of cinemas in several markets in the southern U.S. The owners would like to estimate weekly gross revenue as a function of advertising expenditures. Data for a sample of eight markets for a recent week follow. Market Weekly Gross Revenue($100s) Television Advertising($100s) Newspaper Advertising($100s) Mobile 102.5 5.1 1.6 Shreveport 52.7 3.2 3.0 Jackson 75.8 4.0 1.5 Birmingham 127.8 4.3 4.0 Little Rock 137.8 3.5 4.3 Biloxi 101.4 3.6 2.3 New Orleans 237.8 5.0 8.4 Baton Rouge 219.6 6.9 5.8 (a) Use the data to develop an estimated regression equation with the amount of television advertising as the independent variable. Let x represent the amount of television advertising. If required, round your answers to three decimal places. For subtractive or negative numbers use a minus sign even if there is a + sign before the blank. (Example: -300) = + x…
- Dixie Showtime Movie Theaters, Inc., owns and operates a chain of cinemas in several markets in the southern U.S. The owners would like to estimate weekly gross revenue as a function of advertising expenditures. Data for a sample of eight markets for a recent week follow. Market Weekly Gross Revenue($100s) Television Advertising($100s) Newspaper Advertising($100s) Mobile 102.3 5.0 1.6 Shreveport 51.9 3.0 3.2 Jackson 75.5 4.0 1.5 Birmingham 127.2 4.4 4.0 Little Rock 137.8 3.6 4.3 Biloxi 101.4 3.5 2.3 New Orleans 237.8 5.0 8.4 Baton Rouge 219.6 6.9 5.8 (a) Use the data to develop an estimated regression equation with the amount of television advertising as the independent variable. Let x represent the amount of television advertising. If required, round your answers to three decimal places. For subtractive or negative numbers use a minus sign even if there is a + sign before the blank. (Example: -300) = + x…Region Product Type Item Projected Sales 2022 (in millions) Projected Sales 2027 (in millions) Projected Sales 2032 (in millions) Americas Legacy A 9 0.8 6.4 Americas Legacy A 8.5 7.8 3.2 Americas Legacy A 13 11.2 8.6 Americas Legacy A 8 7.5 8.1 Americas Legacy A 10.2 14.1 8.3 Americas Legacy A 15.5 12.6 8.9 Americas Legacy A 10.8 11.4 7.6 Americas Legacy A 7.5 12.8 7.2 Americas Legacy A 4.4 10.3 6.6 Americas Legacy A 15.4 6.6 5 Americas Legacy A 11.2 9.3 4.5 Americas Legacy A 13.7 9.6 5.5 Americas Legacy A 9.6 11.7 5.6 Americas Legacy A 3.3 7.8 5.3 Americas Legacy A 14 6 4.3 Americas Legacy A 10.3 9.7 6.5 Americas Legacy A -3.9 9.4 5.4 Americas Legacy A 7.7 9.7 5.1 Americas Legacy A 5.7 6 1.7 Americas Legacy A -2 7.9 3.9 Americas Legacy A -3.3 3 1.1 Americas Legacy A 4.1 7.4 2 Americas Legacy A 13.4 7.1 2.8 Americas Legacy A 10.3 7.7 2.3 Americas Legacy A 1.6 5.1 1.1 Americas Legacy A 16.4 7.7 4.1 Americas Legacy A 7.4 6.2 3.1…School Type Cost 30 Year ROI Annual ROI Private $222,700.00 $1,786,000.00 7.70% Private $176,400.00 $1,758,000.00 8.40% Private $212,200.00 $1,714,000.00 7.80% Public $125,100.00 $1,535,000.00 9.10% Private $212,700.00 $1,529,000.00 7.40% Public $92,910.00 $1,501,000.00 10.10% Private $214,900.00 $1,485,000.00 7.30% Private $217,800.00 $1,483,000.00 7.20% Private $225,600.00 $1,444,000.00 7.00% Private $217,300.00 $1,442,000.00 7.10% Private $226,500.00 $1,441,000.00 7.00% Private $215,500.00 $1,438,000.00 7.20% Private $223,500.00 $1,428,000.00 7.00% Private $226,600.00 $1,414,000.00 7.00% Private $189,300.00 $1,397,000.00 7.50% Public $89,700.00 $1,382,000.00 9.90% Public $87,030.00 $1,376,000.00 10.00% Private $218,200.00 $1,343,000.00 6.90% Private $229,900.00 $1,339,000.00 6.70% Private $148,800.00 $1,321,000.00 8.10% Calculate the estimated ‘Annual % ROI’ when the ‘Cost’ (X) is $160,000. Test the hypothesis: o H0: β1 = 0 o Ha: β1…
- Education pays off, according to a snapshot provided by the Bureau of Labor Statistics.8 The median weekly earnings for six different levels of education are shown in the table:Educational Level Median Weekly Earnings ($)Less than a high school diploma 454High school graduate 626Some college, no degree 699Associate degree 761Bachelor’s degree 1025Master’s degree 1257Professional degree 1529Doctoral degree 1532Source: Bureau of Labor Statistics, Current Population…Dixie Showtime Movie Theaters, Inc., owns and operates a chain of cinemas in several markets in the southern U.S. The owners would like to estimate weekly gross revenue as a function of advertising expenditures. Data for a sample of eight markets for a recent week follow. Market Weekly Gross Revenue($100s) Television Advertising($100s) Newspaper Advertising($100s)Mobile 101.3 4.9 1.4Shreveport 52.9 3.1 3.2Jackson 75.8 4.2 1.5Birmingham 127.2 4.5 4.3Little Rock 137.8 3.6 4Biloxi 102.4 3.5 2.3New Orleans 236.8 5 8.4Baton Rouge 220.6 6.8 5.9(a) Use the data to develop an estimated regression with the amount of television advertising as the independent variable.Let x represent the amount of television advertising.If required, round your answers to three decimal places. For subtractive or negative numbers use a minus sign even if there is a + sign before the blank. (Example: -300)= -43.258+ 39.367xTest for a significant relationship between television advertising and weekly gross revenue at…Pricing Refrigerators. Best Buy, a nationwide retailer of electronics, computers, and appliances, sells several brands of refrigerators. A random sample of models of full size refrigerators prices sold by Best Buy and the corresponding cubic feet (cu.ft.) and list price follow (Best Buy website). Model Thru-the-Door Ice and Water? Cubic Feet List Price Frigidaire Gallery Custom-Flex Top-Freezer Refrigerator No 18.3 $899.99 GE French Door Refrigerator No 24.8 $1,599.99 GE Frost-Free Side-by-Side Refrigerator with Thru-the-Door Ice and Water Yes 25.4 $1,599.99 Whirlpool Top-Freezer Refrigerator No 19.3 $749.99 GE Frost-Free Top-Freezer No 17.5 $599.99 Whirlpool French Door Refrigerator with Thru-the-Door Ice and Water Yes 19.6 $1,619.99 Samsung French Door Refrigerator No 25.0 $999.99 Samsung Side-by-Side Refrigerator No 24.5 $1,299.99 Whirlpool Side-by-Side Refrigerator with Thru-the-Door Ice and Water Yes 25.4 $1,299.99 Frigidaire Gallery Frost-Free…
- Region Product Type Item Projected Sales 2022 (in millions) Projected Sales 2027 (in millions) Projected Sales 2032 (in millions) Americas New B 21 14.7 10.3 Americas New B 18.7 15.7 12 Americas New B 19 15.4 11.3 Americas New B 15.1 17.4 11.1 Americas New B 16.7 14.4 10.8 Americas New B 20 15.8 11.5 Americas New B 20.4 14.4 9.6 Americas New B 21 14.8 11.8 Americas New B 19.7 17 13.2 Americas New B 19.3 12.9 10.8 Americas New B 18.4 15.4 10.6 Americas New B 15.1 13 10.5 Americas New B 18.5 13.5 9.2 Americas New B 16.2 10.5 7.9 Americas New B 19.7 12.8 8.7 Americas New B 14.6 10.8 8.1 Americas New B 20.4 13.3 7.7 Americas New B 15.1 12.7 9.4 Americas New B 19.8 15 9.8 Americas New B 14.8 11 8.5 Americas New B 16.6 10 8.6 Americas New B 12 12.3 8.3 Americas New B 19.8 13.3 7.5 Americas New B 17.8 15.2 9.9 Americas New B 20.1 11 8.1 Americas New B 15.9 10.8 8 Americas New B 11.7 12.9 7.8 Americas New B 20.4 13 7.7 Americas New B…Sales, Production, Direct Materials Purchases, and Direct Labor Cost Budgets The budget director of Gourmet Grill Company requests estimates of sales, production, and other operating data from the various administrative units every month. Selected information concerning sales and production for July is summarized as follows: a. Estimated sales for July by sales territory: Maine: Backyard Chef 310 units at $700 per unit Master Chef 150 units at $1,200 per unit Vermont: Backyard Chef 240 units at $750 per unit Master Chef 110 units at $1,300 per unit New Hampshire: Backyard Chef 360 units at $750 per unit Master Chef 180 units at $1,400 per unit b. Estimated inventories at July 1: Direct materials: Grates 290 units Stainless steel 1,500 lbs. Burner subassemblies 170 units Shelves 340 units Finished products: Backyard Chef 30 units Master Chef 32 units c. Desired inventories at July 31: Direct materials: Grates 340 units Stainless steel…Observation no TV budget ($ 1000) Radio budget ($ 1000) Newspaper budget ($ 1000) Sales quantity (1000 units) 99 289,7 42,3 51,2 25,4 100 135,2 41,7 45,9 17,2 101 222,4 4,3 49,8 11,7 102 296,4 36,3 100,9 23,8 103 280,2 10,1 21,4 14,8 104 187,9 17,2 17,9 14,7 105 238,2 34,3 5,3 20,7 106 137,9 46,4 59 19,2 107 25 11 29,7 7,2 108 90,4 0,3 23,2 8,7 A researcher collected statistics on the sales amount of a product in 120 different markets and the advertising budgets used in TV, radio and newspaper media channels for each of these markets. (Data set was adapted from https://www.kaggle.com/ishaanv/ISLR-Auto). The sales amount are expressed in 1000 units, and the budgets are expressed in 1000 $. The researcher wants to create a simple linear regression model by choosing one among the TV, radio and newspaper advertising budgets to explain the amount of sales.…