For the polar function r (0) = 2+3 sin 0 do the following: 1. Create a table of values for 0 E 0, 27 to help you graph the function. Include both the exact values and the decimal approximations in your table. Show the algebraic work you do to get the exact values. (Consider using the Microsoft Word equation editor, or handwriting your work and taking a picture.) 2. For each of the negative r values in your table, write the corresponding point which has a positive r value. Explain how you get these. 3. Use the polar graph template below to draw a graph for this function. Plot each of the points from your table of values, and label at least eight of the points with their coordinates. (Decimal approximations are fine here.) Do not use technology to graph this! Here are some options for how to use the template:
For the polar function r (0) = 2+3 sin 0 do the following: 1. Create a table of values for 0 E 0, 27 to help you graph the function. Include both the exact values and the decimal approximations in your table. Show the algebraic work you do to get the exact values. (Consider using the Microsoft Word equation editor, or handwriting your work and taking a picture.) 2. For each of the negative r values in your table, write the corresponding point which has a positive r value. Explain how you get these. 3. Use the polar graph template below to draw a graph for this function. Plot each of the points from your table of values, and label at least eight of the points with their coordinates. (Decimal approximations are fine here.) Do not use technology to graph this! Here are some options for how to use the template:

Algebra & Trigonometry with Analytic Geometry
13th Edition
ISBN:9781133382119
Author:Swokowski
Publisher:Swokowski
Chapter11: Topics From Analytic Geometry
Section: Chapter Questions
Problem 10DE

Related questions
Question
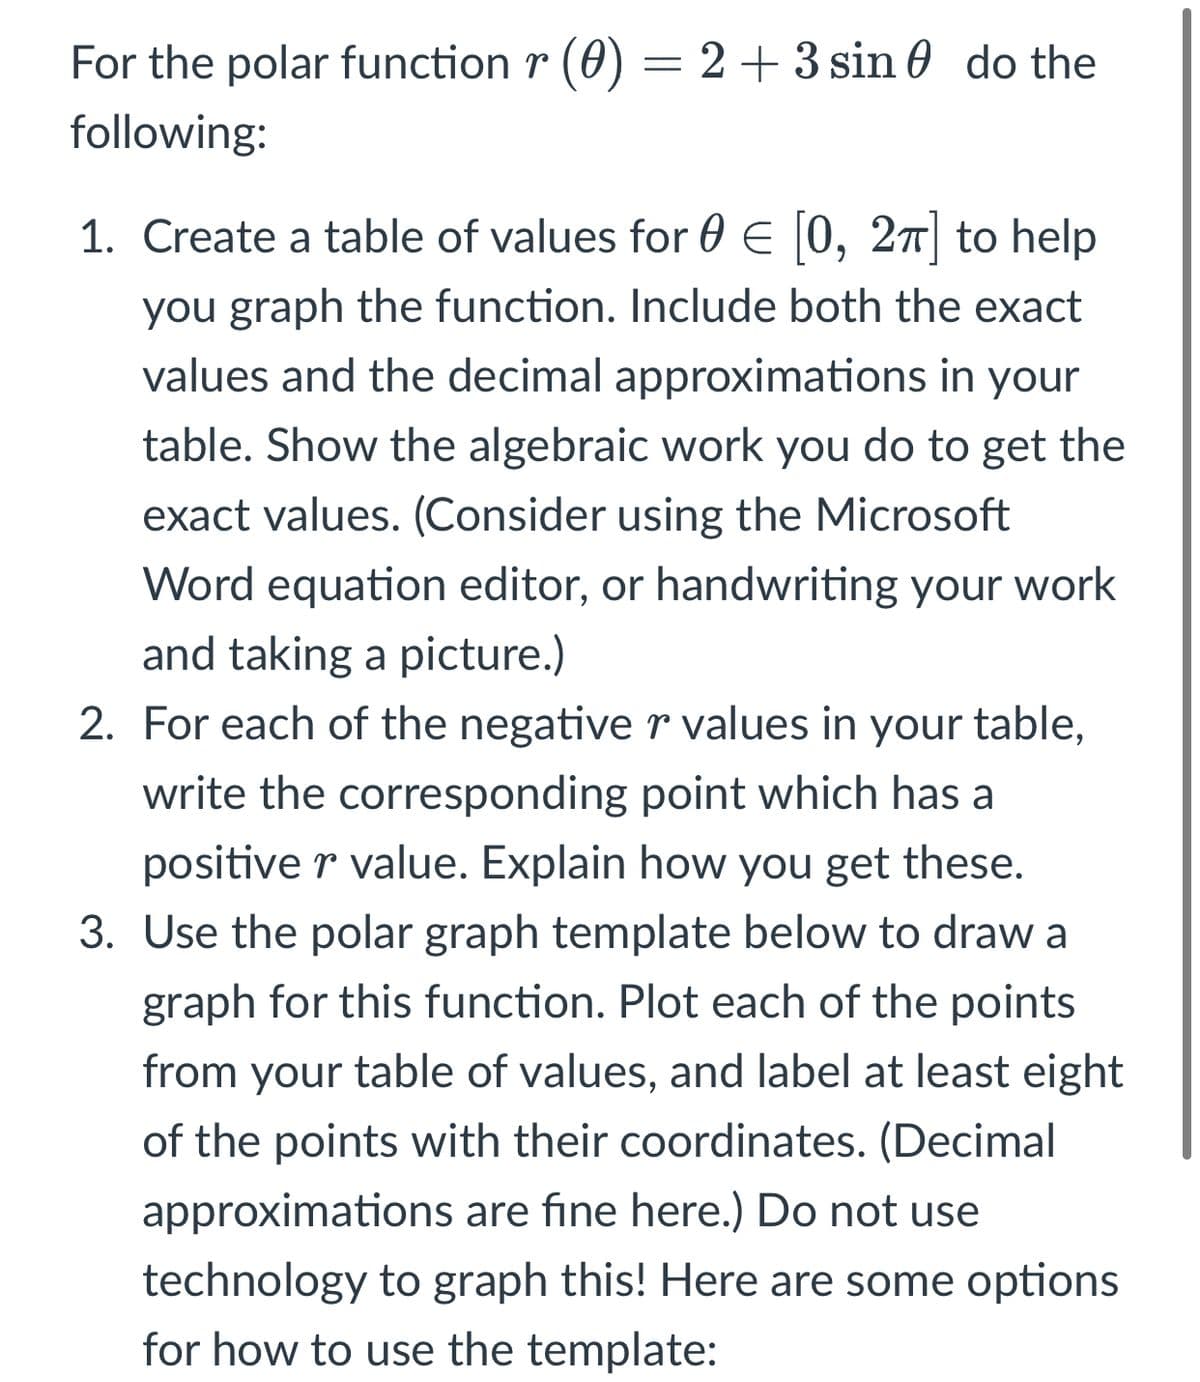
Transcribed Image Text:For the polar function r (0) = 2 + 3 sin 0 do the
following:
1. Create a table of values for 0 E |0, 27 to help
you graph the function. Include both the exact
values and the decimal approximations in your
table. Show the algebraic work you do to get the
exact values. (Consider using the Microsoft
Word equation editor, or handwriting your work
and taking a picture.)
2. For each of the negativer values in your table,
write the corresponding point which has a
positive r value. Explain how you get these.
3. Use the polar graph template below to draw a
graph for this function. Plot each of the points
from your table of values, and label at least eight
of the points with their coordinates. (Decimal
approximations are fine here.) Do not use
technology to graph this! Here are some options
for how to use the template:
Expert Solution
This question has been solved!
Explore an expertly crafted, step-by-step solution for a thorough understanding of key concepts.

This is a popular solution!

Trending now
This is a popular solution!

Step by step
Solved in 4 steps with 1 images

Recommended textbooks for you
Algebra & Trigonometry with Analytic Geometry
Algebra
ISBN:
9781133382119
Author:
Swokowski
Publisher:
Cengage
Algebra & Trigonometry with Analytic Geometry
Algebra
ISBN:
9781133382119
Author:
Swokowski
Publisher:
Cengage