For the regions A and B shown in the graph: A: Discuss the limits of integration. B: Set up an integral expression that represents the total area. C: Calculate the total area. 5 4 3 2 1 0 -1 26 -5 -4 -3 -2 A -1 y B O 1 y = x²+1 2 x = (y-3)²-2 3 4 5 X 6
For the regions A and B shown in the graph: A: Discuss the limits of integration. B: Set up an integral expression that represents the total area. C: Calculate the total area. 5 4 3 2 1 0 -1 26 -5 -4 -3 -2 A -1 y B O 1 y = x²+1 2 x = (y-3)²-2 3 4 5 X 6

Functions and Change: A Modeling Approach to College Algebra (MindTap Course List)
6th Edition
ISBN:9781337111348
Author:Bruce Crauder, Benny Evans, Alan Noell
Publisher:Bruce Crauder, Benny Evans, Alan Noell
ChapterA: Appendix
SectionA.2: Geometric Constructions
Problem 10P: A soda can has a volume of 25 cubic inches. Let x denote its radius and h its height, both in...

Related questions
Question
Solve it on paper!
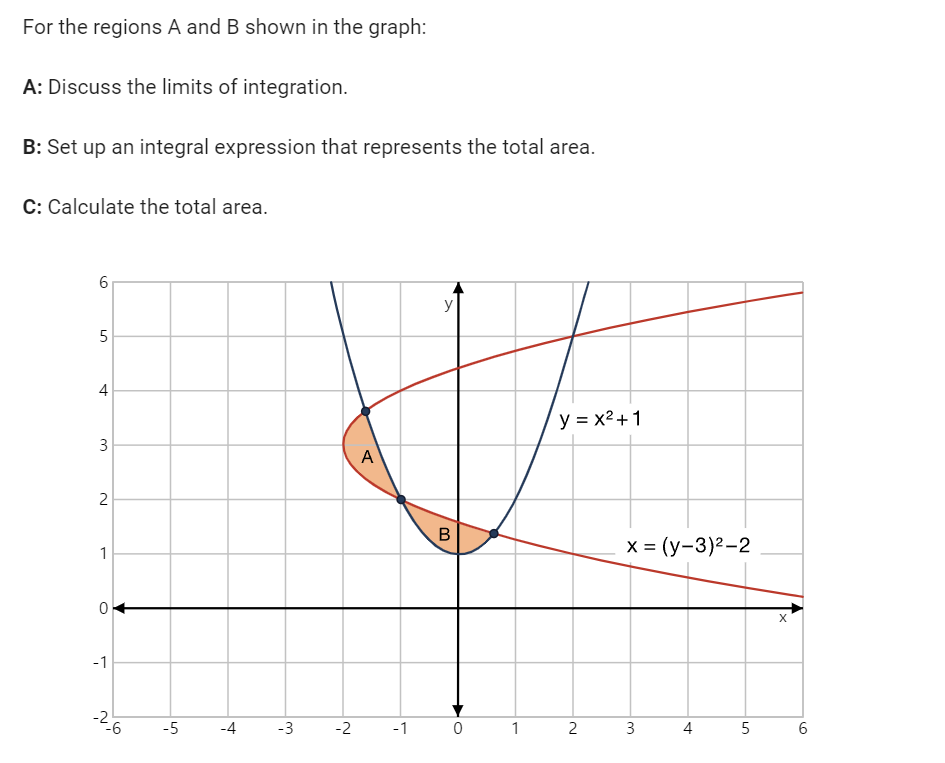
Transcribed Image Text:For the regions A and B shown in the graph:
A: Discuss the limits of integration.
B: Set up an integral expression that represents the total area.
C: Calculate the total area.
6
5
4
3
2
1
0
-1
26
-5
-4
-3
-2
A
-1
y
B
0
1
y = x²+1
2
x = (y-3)²-2
3
4 5
X
6
Expert Solution
This question has been solved!
Explore an expertly crafted, step-by-step solution for a thorough understanding of key concepts.

Step by step
Solved in 4 steps with 4 images

Recommended textbooks for you
Functions and Change: A Modeling Approach to Coll…
Algebra
ISBN:
9781337111348
Author:
Bruce Crauder, Benny Evans, Alan Noell
Publisher:
Cengage Learning
Functions and Change: A Modeling Approach to Coll…
Algebra
ISBN:
9781337111348
Author:
Bruce Crauder, Benny Evans, Alan Noell
Publisher:
Cengage Learning