The growth G of a population of lower organisms over a day is a function of the population size n at the beginning of the day. If both n and G are measured in thousands of organisms, the formula is G--0.03n + n. (0) Make a graph of G versus n. Include values of n up to 40 thousand organisms. G. 10 20 30 40 10 20 30 40 10- 10 10 20 30 40 10 20 30 (b) Calculate G(36). G(36) - thousand organisms Explain in practical terms what your answer means. the line is decreasing Soore 0.33 out of 0.33 Commert:
The growth G of a population of lower organisms over a day is a function of the population size n at the beginning of the day. If both n and G are measured in thousands of organisms, the formula is G--0.03n + n. (0) Make a graph of G versus n. Include values of n up to 40 thousand organisms. G. 10 20 30 40 10 20 30 40 10- 10 10 20 30 40 10 20 30 (b) Calculate G(36). G(36) - thousand organisms Explain in practical terms what your answer means. the line is decreasing Soore 0.33 out of 0.33 Commert:

Algebra & Trigonometry with Analytic Geometry
13th Edition
ISBN:9781133382119
Author:Swokowski
Publisher:Swokowski
Chapter7: Analytic Trigonometry
Section7.6: The Inverse Trigonometric Functions
Problem 91E

Related questions
Question
Transcribed Image Text:NEW Aile
DREARAGE
244
Audits M..
INCIDENT
G - | 2.4 3 - Paint
File
Home
Vlew
X cut
t Crop
Outline
AN
.19 Brushes
A Copy
O Resize
Fill
Paste
Select
Size
Color
Color
2
Edit
A Rotate -
colo
colo
Clipboard
Image
Tools
Shapes
Colors
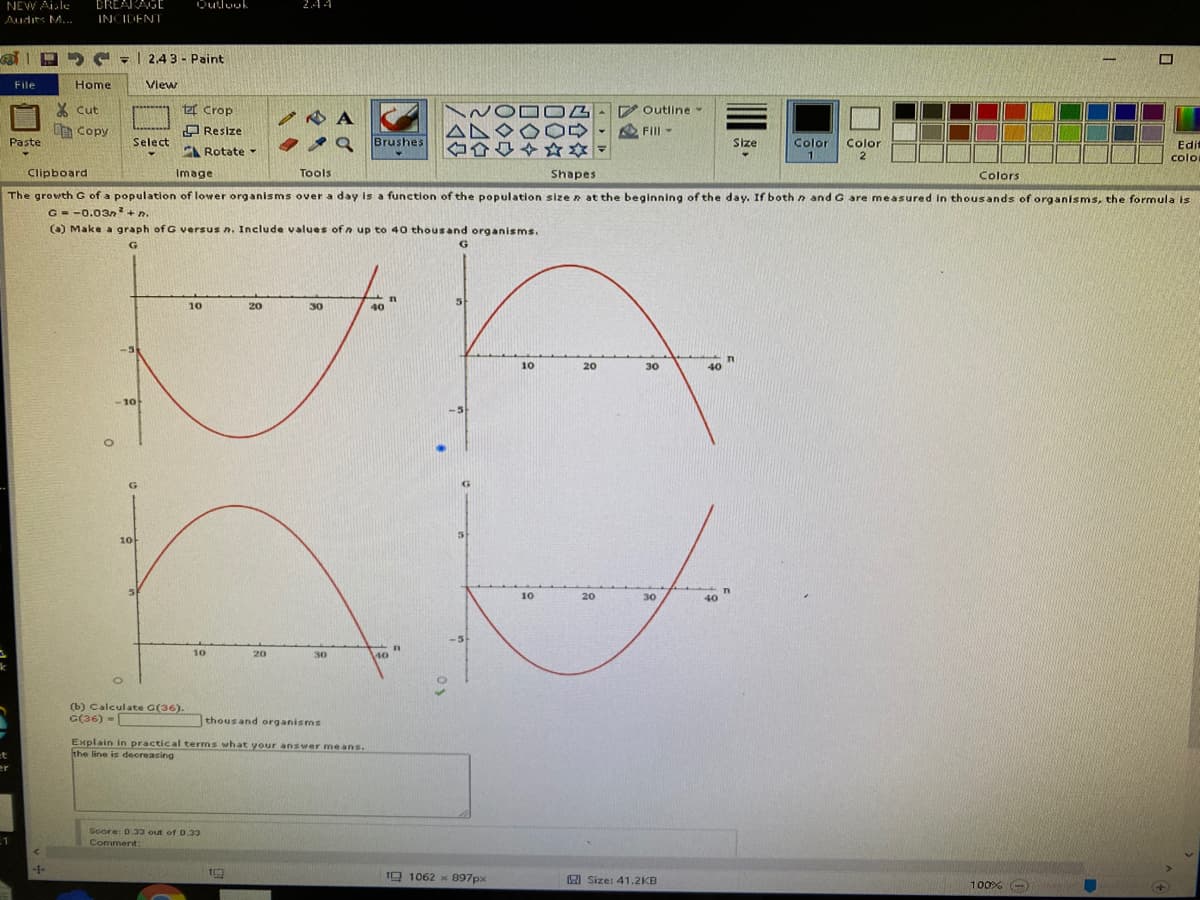
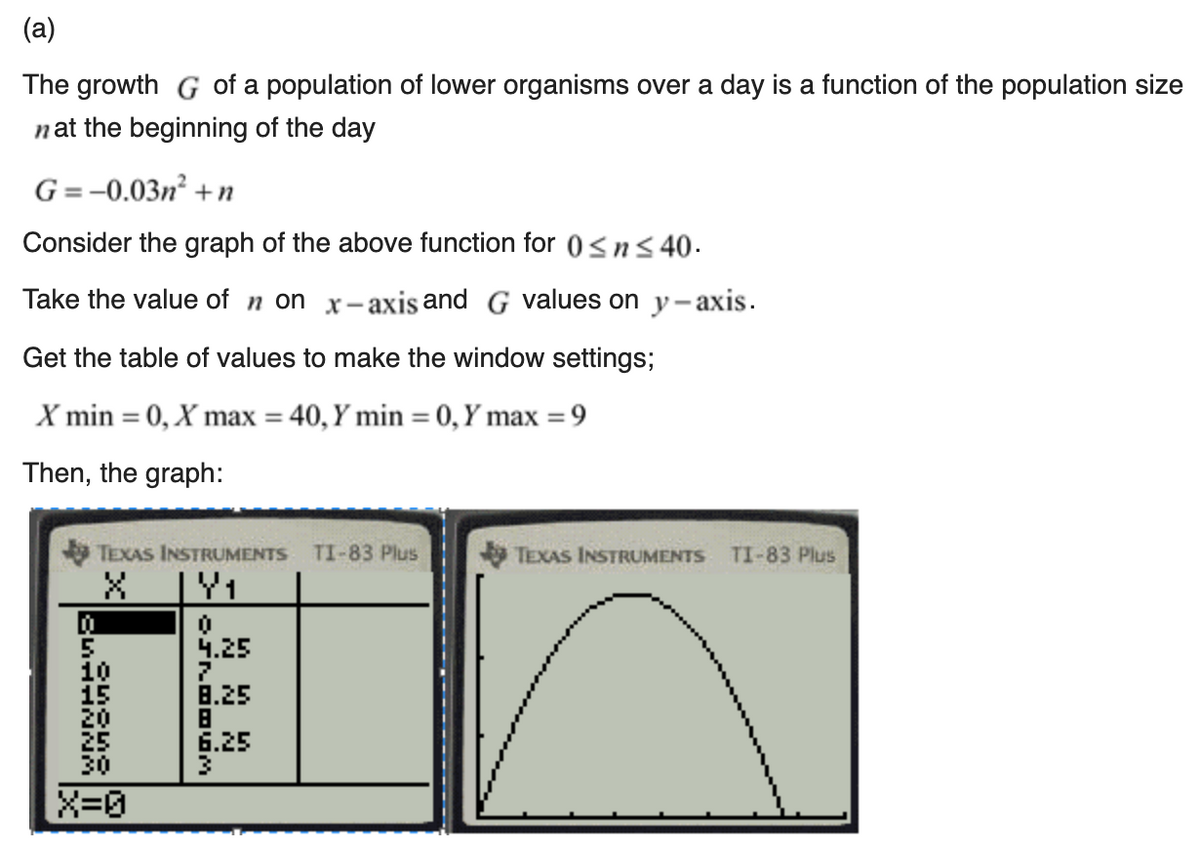
The growth G of a population of lower organisms over a day is a function of the population size n at the beginning of the day. If both n and G are me asured in thousands of organisms, the formula is
G = -0.03n+n.
() Make a graph of G versus n. Include values of n up to 40 thousand organisms.
10
20
30
40
10
20
30
40
-10
10
10
20
30
40
-5
10
20
30
40
(b) Calculate G(36).
G(36) -
thousand organisms
Explain in practical terms what your answer means.
the line is deoreasing
er
Soore: D.33 out of 0.33
Comment:
10 1062 x B97px
A Size: 41.2KB
100% -
四合
00
Expert Solution
Step 1

Trending now
This is a popular solution!

Step by step
Solved in 2 steps with 2 images

Follow-up Questions
Read through expert solutions to related follow-up questions below.
Follow-up Question
For what two population levels will the population grow by 2 thousand over a day ?
Solution
Knowledge Booster


Learn more about
Need a deep-dive on the concept behind this application? Look no further. Learn more about this topic, advanced-math and related others by exploring similar questions and additional content below.Recommended textbooks for you
Algebra & Trigonometry with Analytic Geometry
Algebra
ISBN:
9781133382119
Author:
Swokowski
Publisher:
Cengage
Algebra & Trigonometry with Analytic Geometry
Algebra
ISBN:
9781133382119
Author:
Swokowski
Publisher:
Cengage