For which sample size (n) and sample proportion (6) can a normal curve be used to approximate the sampling distribution? O A. n = 34; p = 0.2 OB. n=34; p = 0.4 OC. n = 29; p = 0.3 D. n = = 29; p = 0.9
For which sample size (n) and sample proportion (6) can a normal curve be used to approximate the sampling distribution? O A. n = 34; p = 0.2 OB. n=34; p = 0.4 OC. n = 29; p = 0.3 D. n = = 29; p = 0.9

Glencoe Algebra 1, Student Edition, 9780079039897, 0079039898, 2018
18th Edition
ISBN:9780079039897
Author:Carter
Publisher:Carter
Chapter10: Statistics
Section10.4: Distributions Of Data
Problem 19PFA

Related questions
Question
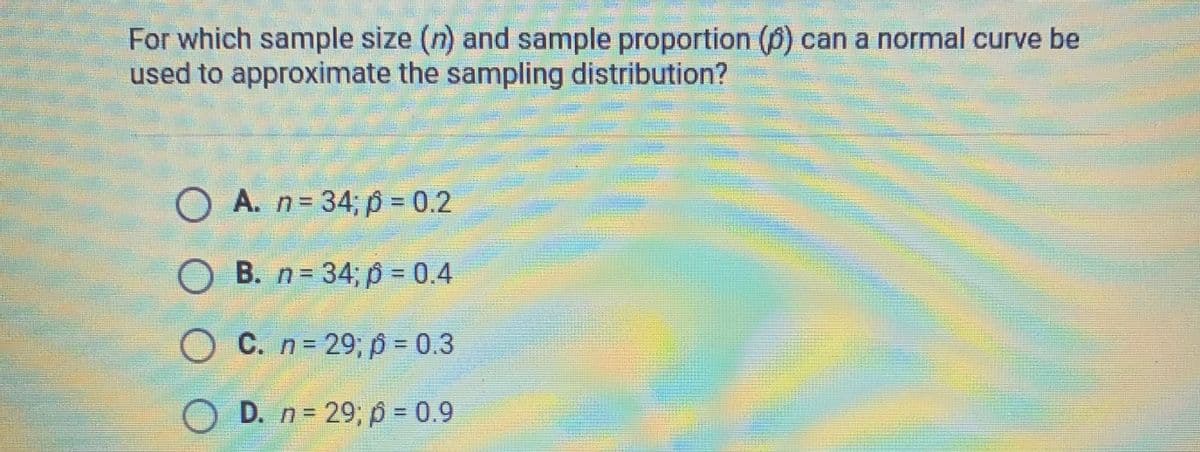
Transcribed Image Text:For which sample size (n) and sample proportion (6) can a normal curve be
used to approximate the sampling distribution?
O A. n=34; p = 0.2
OB. n = 34; p = 0.4
OC. n = 29; p = 0.3
D. n = 29; p = 0.9
Expert Solution
This question has been solved!
Explore an expertly crafted, step-by-step solution for a thorough understanding of key concepts.

This is a popular solution!

Trending now
This is a popular solution!

Step by step
Solved in 2 steps

Recommended textbooks for you
Glencoe Algebra 1, Student Edition, 9780079039897…
Algebra
ISBN:
9780079039897
Author:
Carter
Publisher:
McGraw Hill
Glencoe Algebra 1, Student Edition, 9780079039897…
Algebra
ISBN:
9780079039897
Author:
Carter
Publisher:
McGraw Hill