Four hundred and fifty lbmol/h (204 kmol/h) of a mixture of 60 mol% benzene (LK) and 40 mol% toluene (HK) is to be separated into a liquid distillate and a liquid bottoms product of 95 mol% and 5 mol % benzene, respectively. The feed enters the column with a molar per- vaporization equal to the distillate-to-feed ratio. Use the McCabe-Thiele method to compute, at 1 atm (101.3 kPa): (a) Nmin, and the optimal feed-stage location. Also, compare the results with (b) Amin, and (c) number of equilibrium stages N, for R/Rmin: 1.3, those from a process simulator. and cent
Four hundred and fifty lbmol/h (204 kmol/h) of a mixture of 60 mol% benzene (LK) and 40 mol% toluene (HK) is to be separated into a liquid distillate and a liquid bottoms product of 95 mol% and 5 mol % benzene, respectively. The feed enters the column with a molar per- vaporization equal to the distillate-to-feed ratio. Use the McCabe-Thiele method to compute, at 1 atm (101.3 kPa): (a) Nmin, and the optimal feed-stage location. Also, compare the results with (b) Amin, and (c) number of equilibrium stages N, for R/Rmin: 1.3, those from a process simulator. and cent

Introduction to Chemical Engineering Thermodynamics
8th Edition
ISBN:9781259696527
Author:J.M. Smith Termodinamica en ingenieria quimica, Hendrick C Van Ness, Michael Abbott, Mark Swihart
Publisher:J.M. Smith Termodinamica en ingenieria quimica, Hendrick C Van Ness, Michael Abbott, Mark Swihart
Chapter1: Introduction
Section: Chapter Questions
Problem 1.1P

Related questions
Question
Redo Example 7.1, keeping everything the same but assuming a relative volatility of 1.7.
Transcribed Image Text:and Toluene.
EXAMPLE 7.1 Distillation of a Mixture of Benzene
Four hundred and fifty lbmol/h (204 kmol/h) of a mixture of 60 mol%
liquid distillate and a liquid bottoms product of 95 mol% and 5 mol %
benzene (LK) and 40 mol % toluene (HK) is to be separated into a
, respectively. The feed enters the column with a molar per-
vaporization equal to the distillate-to-feed ratio. Use the
McCabe-Thiele method to compute, at 1 atm (101.3 kPa): (a) min,
(b) Rmin, and (c) number of equilibrium stages N, for R/Rmin = 1.3,
and the optimal feed-stage location. Also, compare the results with
benzene,
cent
those from a process s
Solution
simulator.
First calculate D and B. An overall material balance on benzene
gives
From (7-26),
0.60(450) = 0.95D +0.05B
450D + B
A total balance gives
Combining (1) and (2) and solving, D = 275 lbmol/h, B = 175
Ibmol/h, and D/F = 0.611. Thus, the molar vaporization of the feed
is 61.1%.
Calculate the slope of the q-line:
VF/F = D/F = 0.611, and g for a partially vaporized feed is
LF (F-VF)
F
F
the slope of the q-line is
= 1
9
q-1
=
VF
F
= 0.389
0.389
0.389-1
= -0.637
R
1.59
= 0.614
R+1 1.59 + 1
(1)
(2)
=
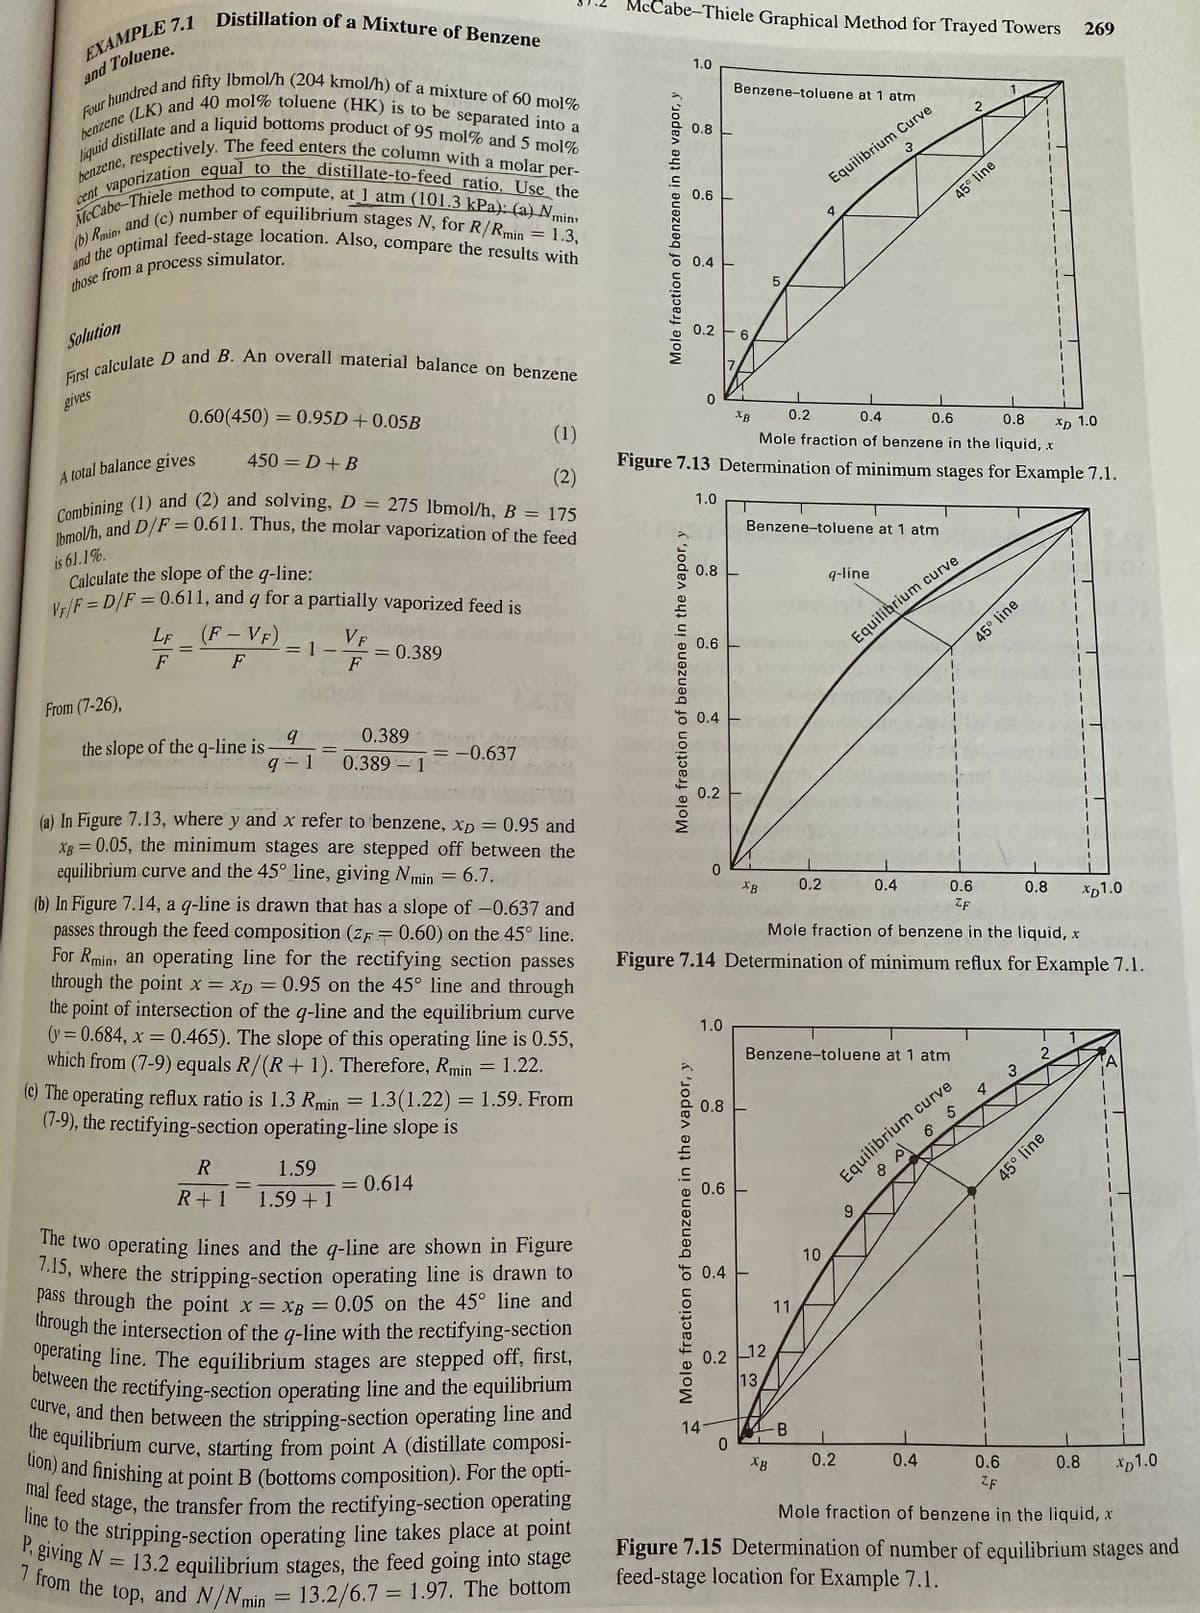
(a) In Figure 7.13, where y and x refer to benzene, xp = 0.95 and
x = 0.05, the minimum stages are stepped off between the
equilibrium curve and the 45° line, giving Nmin = 6.7.
(b) In Figure 7.14, a q-line is drawn that has a slope of -0.637 and
passes through the feed composition (z= 0.60) on the 45° line.
For Rmin, an operating line for the rectifying section passes
through the point x = xp = 0.95 on the 45° line and through
the point of intersection of the q-line and the equilibrium curve
(y=0.684, x = 0.465). The slope of this operating line is 0.55,
which from (7-9) equals R/(R+ 1). Therefore, Rmin = 1.22.
(c) The operating reflux ratio is 1.3 Rmin = 1.3 (1.22) = 1.59. From
(7-9), the rectifying-section operating-line slope is
=
XB
The two operating lines and the q-line are shown in Figure
7.15, where the stripping-section operating line is drawn to
pass through the point x = xp = 0.05 on the 45° line and
through the intersection of the q-line with the rectifying-section
operating line. The equilibrium stages are stepped off, first,
between the rectifying-section operating line and the equilibrium
curve, and then between the stripping-section operating line and
the equilibrium curve, starting from point A (distillate composi-
tion) and finishing at point B (bottoms composition). For the opti-
mal feed stage, the transfer from the rectifying-section operating
line to the stripping-section operating line takes place at point
P, giving N= 13.2 equilibrium stages, the feed going into stage
7 from the top, and N/Nmin
=
= 13.2/6.7 1.97. The bottom
N
Cabe-Thiele Graphical Method for Trayed Towers
Mole fraction of benzene in the vapor, y
Mole fraction of benzene in the vapor, y
1.0
0.8
0.6
0.4
Mole fraction of benzene in the vapor, y
0.2
0
1.0
0.8
0.6
0.4
0.2
0
0.4
0.6
0.8
XD 1.0
Mole fraction of benzene in the liquid, x
Figure 7.13 Determination of minimum stages for Example 7.1.
1.0
0.8
0.6
0.4
Benzene-toluene at 1 atm
14-
6
XB
0
XB
LO
0.2 12
13,
5
0.2
Benzene-toluene at 1 atm
XB
0.6
xD 1.0
ZF
Mole fraction of benzene in the liquid, x
Figure 7.14 Determination of minimum reflux for Example 7.1.
Equilibrium Curve
0.2
11
4
B
10
q-line
Benzene-toluene at 1 atm
Equilibrium
0.4
0.2
45° line
curve
9
Equilibrium curve
6
5
0.4
45° line
4
1
0.6
ZF
0.8
3
269
2
45° line
A
0.8 x1.0
Mole fraction of benzene in the liquid, x
Figure 7.15 Determination of number of equilibrium stages and
feed-stage location for Example 7.1.
Expert Solution


Trending now
This is a popular solution!

Step by step
Solved in 10 steps with 10 images

Recommended textbooks for you
Introduction to Chemical Engineering Thermodynami…
Chemical Engineering
ISBN:
9781259696527
Author:
J.M. Smith Termodinamica en ingenieria quimica, Hendrick C Van Ness, Michael Abbott, Mark Swihart
Publisher:
McGraw-Hill Education

Elementary Principles of Chemical Processes, Bind…
Chemical Engineering
ISBN:
9781118431221
Author:
Richard M. Felder, Ronald W. Rousseau, Lisa G. Bullard
Publisher:
WILEY

Elements of Chemical Reaction Engineering (5th Ed…
Chemical Engineering
ISBN:
9780133887518
Author:
H. Scott Fogler
Publisher:
Prentice Hall
Introduction to Chemical Engineering Thermodynami…
Chemical Engineering
ISBN:
9781259696527
Author:
J.M. Smith Termodinamica en ingenieria quimica, Hendrick C Van Ness, Michael Abbott, Mark Swihart
Publisher:
McGraw-Hill Education
Elementary Principles of Chemical Processes, Bind…
Chemical Engineering
ISBN:
9781118431221
Author:
Richard M. Felder, Ronald W. Rousseau, Lisa G. Bullard
Publisher:
WILEY
Elements of Chemical Reaction Engineering (5th Ed…
Chemical Engineering
ISBN:
9780133887518
Author:
H. Scott Fogler
Publisher:
Prentice Hall


Industrial Plastics: Theory and Applications
Chemical Engineering
ISBN:
9781285061238
Author:
Lokensgard, Erik
Publisher:
Delmar Cengage Learning

Unit Operations of Chemical Engineering
Chemical Engineering
ISBN:
9780072848236
Author:
Warren McCabe, Julian C. Smith, Peter Harriott
Publisher:
McGraw-Hill Companies, The