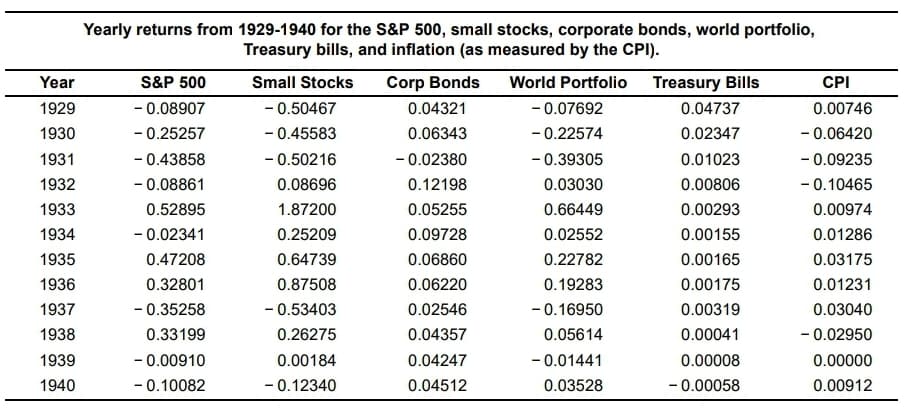
Given the data​ here, Compute the average return for each of the assets from 1929 to 1940 (the Great​ Depression) ​(Round to five decimal​places.) Compute the variance and standard deviation for each of the assets from 1929 to 1940. ​(Round to five decimal​places.) Which asset was riskiest during the Great​ Depression? How does that fit with your​ intuition? ​(Round to five decimal​places.) Note​: Notice that the answers for average​ return, variance and standard deviation must be entered in decimal format.

EBK CONTEMPORARY FINANCIAL MANAGEMENT
14th Edition
ISBN:9781337514835
Author:MOYER
Publisher:MOYER
Chapter2: The Domestic And International Financial Marketplace
Section: Chapter Questions
Problem 1P
icon
Related questions
Question

Given the data​ here,

  1. Compute the average return for each of the assets from 1929 to 1940 (the Great​ Depression) ​(Round to five decimal​places.)
  2. Compute the variance and standard deviation for each of the assets from 1929 to 1940. ​(Round to five decimal​places.)
  3. Which asset was riskiest during the Great​ Depression? How does that fit with your​ intuition? ​(Round to five decimal​places.)

Note​: Notice that the answers for average​ return, variance and standard deviation must be entered in decimal format.


Yearly returns from 1929-1940 for the S&P 500, small stocks, corporate bonds, world portfolio,
Treasury bills, and inflation (as measured by the CPI).
Year
S&P 500
Small Stocks
Corp Bonds
World Portfolio Treasury Bills
CPI
1929
- 0.08907
- 0.50467
0.04321
- 0.07692
0.04737
0.00746
1930
- 0.25257
- 0.45583
0.06343
- 0.22574
0.02347
- 0.06420
- 0.02380
- 0.43858
- 0.08861
1931
- 0.50216
- 0.39305
0.01023
- 0.09235
1932
0.08696
0.12198
0.03030
0.00806
- 0.10465
1933
0.52895
1.87200
0.05255
0.66449
0.00293
0.00974
1934
- 0.02341
0.25209
0.09728
0.02552
0.00155
0.01286
1935
0.47208
0.64739
0.06860
0.22782
0.00165
0.03175
1936
0.32801
0.87508
0.06220
0.19283
0.00175
0.01231
1937
- 0.35258
- 0.53403
0.02546
- 0.16950
0.00319
0.03040
1938
0.33199
0.26275
0.04357
0.05614
0.00041
- 0.02950
- 0.00910
- 0.10082
1939
0.00184
0.04247
- 0.01441
0.00008
0.00000
1940
- 0.12340
0.04512
0.03528
- 0.00058
0.00912
Transcribed Image Text:Yearly returns from 1929-1940 for the S&P 500, small stocks, corporate bonds, world portfolio, Treasury bills, and inflation (as measured by the CPI). Year S&P 500 Small Stocks Corp Bonds World Portfolio Treasury Bills CPI 1929 - 0.08907 - 0.50467 0.04321 - 0.07692 0.04737 0.00746 1930 - 0.25257 - 0.45583 0.06343 - 0.22574 0.02347 - 0.06420 - 0.02380 - 0.43858 - 0.08861 1931 - 0.50216 - 0.39305 0.01023 - 0.09235 1932 0.08696 0.12198 0.03030 0.00806 - 0.10465 1933 0.52895 1.87200 0.05255 0.66449 0.00293 0.00974 1934 - 0.02341 0.25209 0.09728 0.02552 0.00155 0.01286 1935 0.47208 0.64739 0.06860 0.22782 0.00165 0.03175 1936 0.32801 0.87508 0.06220 0.19283 0.00175 0.01231 1937 - 0.35258 - 0.53403 0.02546 - 0.16950 0.00319 0.03040 1938 0.33199 0.26275 0.04357 0.05614 0.00041 - 0.02950 - 0.00910 - 0.10082 1939 0.00184 0.04247 - 0.01441 0.00008 0.00000 1940 - 0.12340 0.04512 0.03528 - 0.00058 0.00912
Expert Solution
trending now

Trending now

This is a popular solution!

steps

Step by step

Solved in 2 steps with 2 images

Blurred answer
Knowledge Booster
Risk and Return
Learn more about
Need a deep-dive on the concept behind this application? Look no further. Learn more about this topic, finance and related others by exploring similar questions and additional content below.
Similar questions
  • SEE MORE QUESTIONS
Recommended textbooks for you
EBK CONTEMPORARY FINANCIAL MANAGEMENT
Finance
ISBN:
9781337514835
Author:
MOYER
Publisher:
CENGAGE LEARNING - CONSIGNMENT
Entrepreneurial Finance
Finance
ISBN:
9781337635653
Author:
Leach
Publisher:
Cengage