Given the following data set, let x be the explanatory variable and y be the response variable. x75 1 8812 y36102398 (a) If a least squares line was fitted to this data, what percentage of the variation in the y would be explained by the regression line? (Enter your answer as a percent.) ANSWER: % (b) Compute the correlation coefficient: r =
Given the following data set, let x be the explanatory variable and y be the response variable. x75 1 8812 y36102398 (a) If a least squares line was fitted to this data, what percentage of the variation in the y would be explained by the regression line? (Enter your answer as a percent.) ANSWER: % (b) Compute the correlation coefficient: r =

Linear Algebra: A Modern Introduction
4th Edition
ISBN:9781285463247
Author:David Poole
Publisher:David Poole
Chapter7: Distance And Approximation
Section7.3: Least Squares Approximation
Problem 31EQ

Related questions
Question
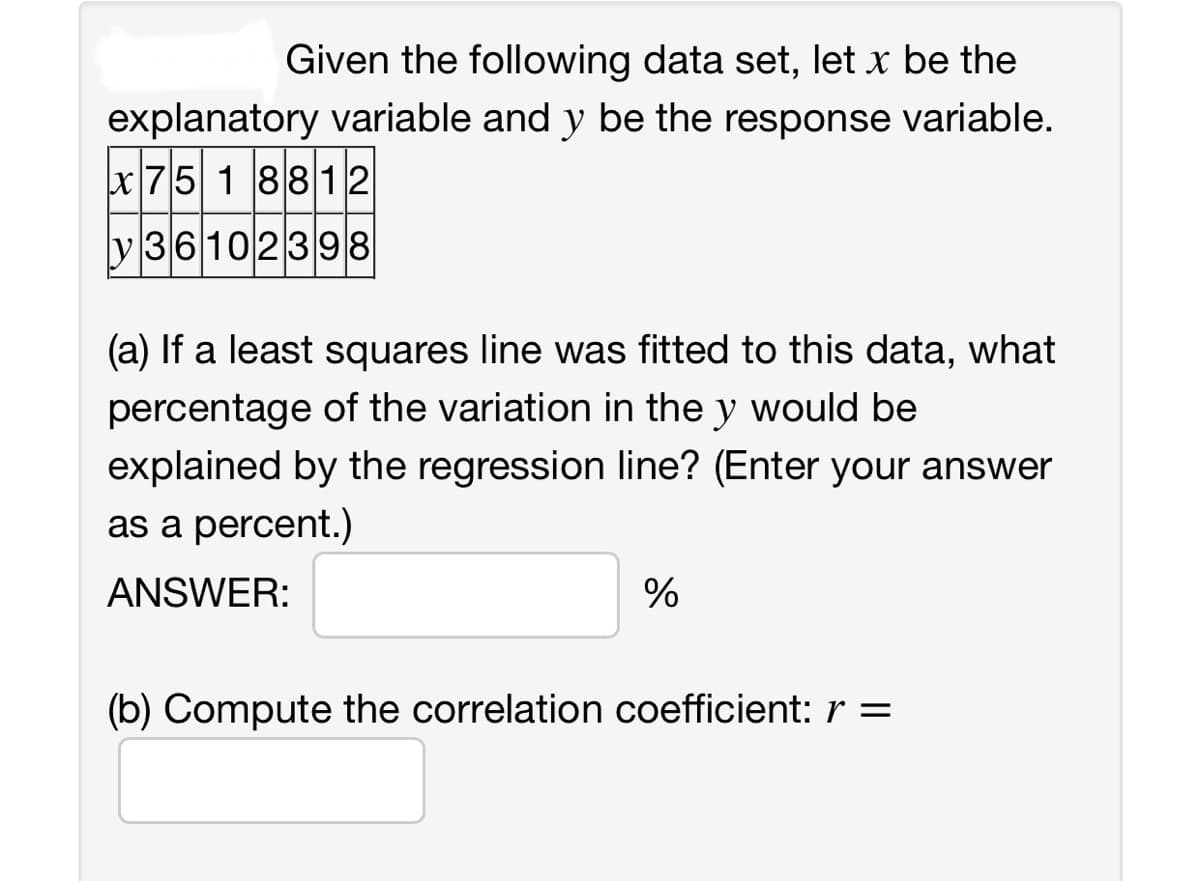
Transcribed Image Text:Given the following data set, let x be the
explanatory variable and y be the response variable.
x75 1 8812
y36102398
(a) If a least squares line was fitted to this data, what
percentage of the variation in the y would be
explained by the regression line? (Enter your answer
as a percent.)
ANSWER:
%
(b) Compute the correlation coefficient: r =
Expert Solution
This question has been solved!
Explore an expertly crafted, step-by-step solution for a thorough understanding of key concepts.

This is a popular solution!

Trending now
This is a popular solution!

Step by step
Solved in 3 steps with 1 images

Recommended textbooks for you
Linear Algebra: A Modern Introduction
Algebra
ISBN:
9781285463247
Author:
David Poole
Publisher:
Cengage Learning

Glencoe Algebra 1, Student Edition, 9780079039897…
Algebra
ISBN:
9780079039897
Author:
Carter
Publisher:
McGraw Hill
Linear Algebra: A Modern Introduction
Algebra
ISBN:
9781285463247
Author:
David Poole
Publisher:
Cengage Learning
Glencoe Algebra 1, Student Edition, 9780079039897…
Algebra
ISBN:
9780079039897
Author:
Carter
Publisher:
McGraw Hill