Given the following financial statements historical ratios, and industry averages, calculate Sterling Com most recent year. (Assume a 365-day year.)
Given the following financial statements historical ratios, and industry averages, calculate Sterling Com most recent year. (Assume a 365-day year.)

Managerial Accounting: The Cornerstone of Business Decision-Making
7th Edition
ISBN:9781337115773
Author:Maryanne M. Mowen, Don R. Hansen, Dan L. Heitger
Publisher:Maryanne M. Mowen, Don R. Hansen, Dan L. Heitger
Chapter15: Financial Statement Analysis
Section: Chapter Questions
Problem 40E: Cuneo Companys income statements for the last 3 years are as follows: Refer to the information for...

Related questions
Question
Practice Pack
Notes:
a. The firm has an 8-year financial lease requiring annual beginning-of-year payments of $50,000. Five years of the lease have yet to run.
b. Annual credit purchases of $6,200,000 were made during the year.
c. The annual principal payment on the long-term debt is $100,000.
d. On December 31, 2012, the firm's common stock closed at $39.50 per share.
Questions:
1. What is the
2. What is the quick ratio?
3. What is the inventory turnover?
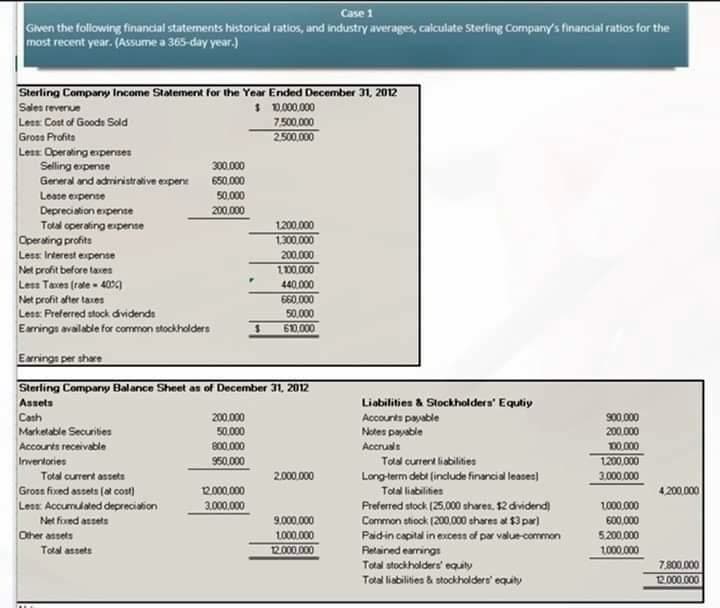
Transcribed Image Text:Case 1
Given the following financial statements historical ratios, and industry averages, calculate Stering Company's financial ratios for the
most recent year. (Assume a 365-day year.)
Sterling Company Income Statement for the Year Ended December 31, 2012
I D.0000
7.500,.000
2500.000
Sales reverue
Less Cost of Goods Sold
Gross Profits
Less: Operating expenses
Selling espense
Gereral and admiristralive expene
300.000
650.000
50.000
Lease espense
Depreciation expense
200.000
Total operaling espense
Operating profits
Less Irterest erpense
1200.000
1300,000
200.000
Net profit before taxes
Less Taxes (rale - 40)
Net profit after taxes
100.000
440.000
660.000
Less: Preferred stock dvidenda
50.000
Eamrings avalable for common stockholders
610.000
Earings per share
Sterling Company Bal arnce Sheet as of December 31, 2012
Assets
Liabilities & Stockholdera' Equliy
Accourts payable
Notes payable
Accruals
Cash
200.000
s00.000
Marketable Securites
Accounts receivable
50.00
200.000
800.000
0.000
1200,000
3.000.000
Inventories
950.000
Taal currert liabilities
Total current assets
2000.000
Gros fixed assets (at cost)
Long-term debt (include financial leases)
Tolal liabilities
20000
4.200,000
300000
L000.000
Preferred stock (25,000 shares. $2 dividend)
Common stiock (200.000 shares at $3 par)
Paidin capital in excess of par value-common
Less Accumulated depreciation
Net fired asseta
9.000.000
600.000
Other assets
1000.000
12.00000
5.00.000
Total assets
Relained earrings
1000.000
Total stockholders' equty
Total liabilities & stockholders' equity
7.800.000
12.000.000
Expert Solution
This question has been solved!
Explore an expertly crafted, step-by-step solution for a thorough understanding of key concepts.

This is a popular solution!

Includes step-by-step video

Trending now
This is a popular solution!

Learn your way
Includes step-by-step video

Step by step
Solved in 2 steps

Knowledge Booster


Learn more about
Need a deep-dive on the concept behind this application? Look no further. Learn more about this topic, accounting and related others by exploring similar questions and additional content below.Recommended textbooks for you
Managerial Accounting: The Cornerstone of Busines…
Accounting
ISBN:
9781337115773
Author:
Maryanne M. Mowen, Don R. Hansen, Dan L. Heitger
Publisher:
Cengage Learning

Managerial Accounting
Accounting
ISBN:
9781337912020
Author:
Carl Warren, Ph.d. Cma William B. Tayler
Publisher:
South-Western College Pub

Cornerstones of Financial Accounting
Accounting
ISBN:
9781337690881
Author:
Jay Rich, Jeff Jones
Publisher:
Cengage Learning
Managerial Accounting: The Cornerstone of Busines…
Accounting
ISBN:
9781337115773
Author:
Maryanne M. Mowen, Don R. Hansen, Dan L. Heitger
Publisher:
Cengage Learning
Managerial Accounting
Accounting
ISBN:
9781337912020
Author:
Carl Warren, Ph.d. Cma William B. Tayler
Publisher:
South-Western College Pub
Cornerstones of Financial Accounting
Accounting
ISBN:
9781337690881
Author:
Jay Rich, Jeff Jones
Publisher:
Cengage Learning

Financial Accounting
Accounting
ISBN:
9781337272124
Author:
Carl Warren, James M. Reeve, Jonathan Duchac
Publisher:
Cengage Learning

Financial Accounting: The Impact on Decision Make…
Accounting
ISBN:
9781305654174
Author:
Gary A. Porter, Curtis L. Norton
Publisher:
Cengage Learning

Survey of Accounting (Accounting I)
Accounting
ISBN:
9781305961883
Author:
Carl Warren
Publisher:
Cengage Learning