Given the graph of the Logarithmic Function g(z) = log, : The graph of the functlon f(x) = 9+ log, (r) can be obtained from the graph of g(x) = log, r %3D by shifting the graph of g(2) Select an answerv 9 units; Identify the Domain and Range of f(x) using Interval Notation. Domain of the function f(x) is Range of the function f(x) is
Given the graph of the Logarithmic Function g(z) = log, : The graph of the functlon f(x) = 9+ log, (r) can be obtained from the graph of g(x) = log, r %3D by shifting the graph of g(2) Select an answerv 9 units; Identify the Domain and Range of f(x) using Interval Notation. Domain of the function f(x) is Range of the function f(x) is

Chapter6: Exponential And Logarithmic Functions
Section6.8: Fitting Exponential Models To Data
Problem 60SE: Use the result from the previous exercise to graph the logistic model P(t)=201+4e0.5t along with its...

Related questions
Question
100%
I'm confused
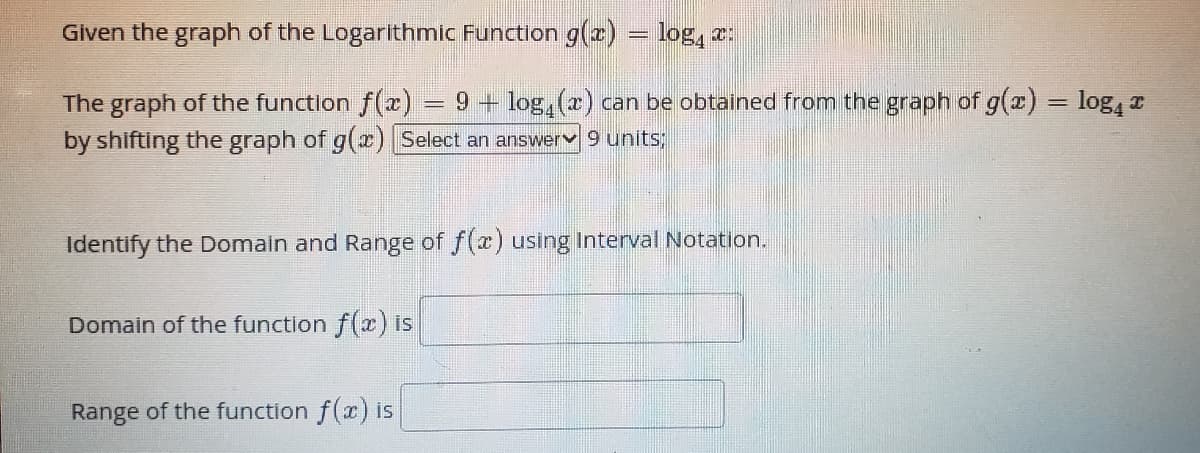
Transcribed Image Text:Given the graph of the Logarithmic Function g(z) = log, c:
The graph of the function f(x) = 9 + log, (r) can be obtained from the graph of g(2) = log,
%3D
by shifting the graph of g(z) Select an answerv 9 units;
Identify the Domain and Range of f(x) using Interval Notation.
Domain of the function f(x) is
Range of the function f(r) is
Expert Solution
This question has been solved!
Explore an expertly crafted, step-by-step solution for a thorough understanding of key concepts.

Step by step
Solved in 2 steps with 2 images

Recommended textbooks for you

Algebra & Trigonometry with Analytic Geometry
Algebra
ISBN:
9781133382119
Author:
Swokowski
Publisher:
Cengage

Algebra and Trigonometry (MindTap Course List)
Algebra
ISBN:
9781305071742
Author:
James Stewart, Lothar Redlin, Saleem Watson
Publisher:
Cengage Learning
Algebra & Trigonometry with Analytic Geometry
Algebra
ISBN:
9781133382119
Author:
Swokowski
Publisher:
Cengage
Algebra and Trigonometry (MindTap Course List)
Algebra
ISBN:
9781305071742
Author:
James Stewart, Lothar Redlin, Saleem Watson
Publisher:
Cengage Learning

College Algebra
Algebra
ISBN:
9781305115545
Author:
James Stewart, Lothar Redlin, Saleem Watson
Publisher:
Cengage Learning